
Is There Such a Thing as Too Much of a Good Thing?
When a child gets given a giant bowl of ice cream after a full day of activity, its hard for them to imagine anything better. However, while the first few bites are almost always filled with pure joy, eating too fast or too much can trigger a brain freeze, sugar crash, or stomachache. Similarly, water is a critical component of life. Humans cannot survive more than a handful of days without it. That said, drinking too much water in a short period of time can actually be fatal. The point is, virtually everything (including the stock market) operates on a curve. In moderation, most things like exercise or sunlight can be beneficial. Nevertheless, if you cross the threshold into excess, it can cause problems. The stock market is no different.
AI Stocks: Too Far Too Fast?
The stock market is a forward-looking mechanism, a game of expectations that tends to climb the proverbial “Wall of worry.” For instance, at the beginning of 2026, investors were skeptical about AI spending, profitability, and the credit market. However, once AI-related stocks began delivering real profits and raised forward guidance, their stocks rose, bucking geopolitical concerns in the Middle East. However, with the S&P 500 Index up 9 straight weeks for just the 14th time in the past century and many AI stocks up triple digits year-to-date, it may finally be time for a breather.
What is a Climax Top?
Currently, things could not be better in Wall Street’s hottest industry – artificial intelligence. Earnings are rising, CAPEX spending is increasing, and the Agentic AI revolution is upon us. That said, the technical action in numerous AI stocks has transformed from bullish to frothy, parabolic, and potentially climactic.
Popularized by legendary growth investor William O’Neil, a climax top is a technical pattern that signals the end of a multi-month advance in a leading growth stock. Below are the characteristics of a climax top:
· Roaring Uptrend: The stock must have already advanced significantly (100 or more over the past few months).
· Accelerated Trend: Next, the stock’s advance turns from an uptrend to a parabolic/vertical move.
· Largest Point Spread: The stock registers its largest daily point gain (not %).
· Blowout Volume: Volume simultaneously soars to well above average, signaling “churning” action.
· Exhaustion Gaps Appear: Euphoria reaches a fever pitch as the stock gaps up overnight (maybe several times), signaling exhaustion.
· Moving Average Extension: Stocks that are 200% or more above the 200-day moving average are considered very extended.
Potential Climax Moves
Below are some potential climax moves that are setting up.
Dell (DELL)
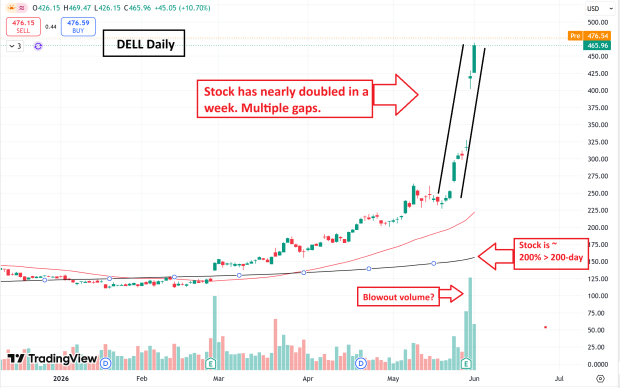
Image Source: TradingView
Arm Holdings (ARM)
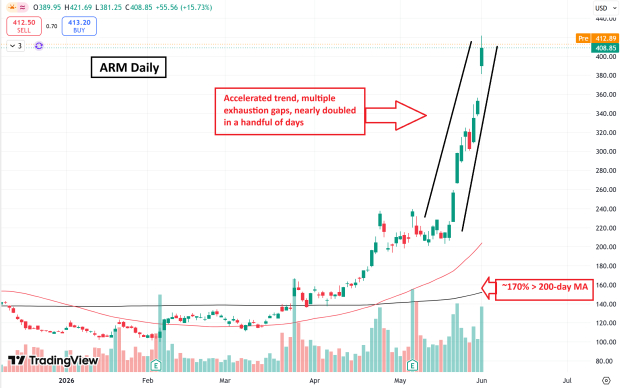
Image Source: TradingView
Micron (MU)
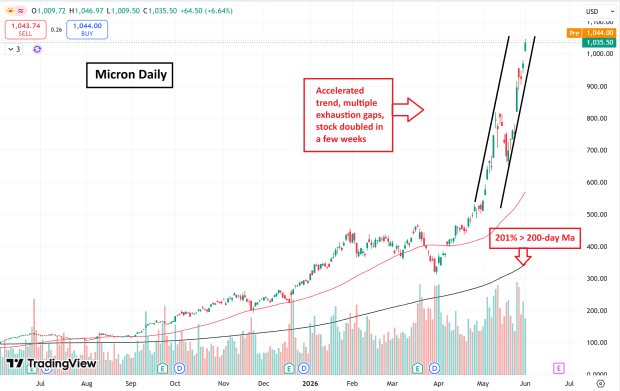
Image Source: TradingView
SanDisk (SNDK), which is in Micron’s industry, is also worth watching as a potential climax top.
Bottom Line
While the fundamental story driving the AI revolution remains undeniably robust, select AI stocks are setting up potential climax top patterns. Keep a close eye on the extended charts of tech giants like Dell, Arm, and Micron.
Zacks' Research Chief Names "Stock Most Likely to Double"
Our team of experts has just released the 5 stocks with the greatest probability of gaining +100% or more in the coming months. Of those 5, Director of Research Sheraz Mian highlights the one stock set to climb highest.
This top pick is a little-known satellite-based communications firm. Space is projected to become a trillion dollar industry, and this company's customer base is growing fast. Analysts have forecasted a major revenue breakout in 2025. Of course, all our elite picks aren't winners but this one could far surpass earlier Zacks' Stocks Set to Double like Hims & Hers Health, which shot up +209%.
Free: See Our Top Stock And 4 Runners UpDell Technologies Inc. (DELL) : Free Stock Analysis Report
Micron Technology, Inc. (MU) : Free Stock Analysis Report
Sandisk Corporation (SNDK) : Free Stock Analysis Report
ARM Holdings PLC Sponsored ADR (ARM) : Free Stock Analysis Report
This article originally published on Zacks Investment Research (zacks.com).
The views and opinions expressed herein are the views and opinions of the author and do not necessarily reflect those of Nasdaq, Inc.

