Another type of technical analysis that we will cover is basic single candlestick patterns, as they are easy to identify and interpret.
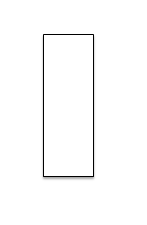
Spinning Top
A spinning top has two long equal length shadows with a small body and typically signals a reversal when they occur during a trend. The reason behind the reversal is that it shows indecision between buyers and sellers, and that neither of them can close much higher or lower than the opening.
Most traders use the strategy of going long a currency pair if a spinning top occurs during a downtrend and shorting a pair if it occurs during a downtrend.
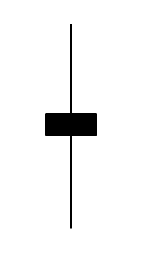
Maruboza
A Maruboza is when a candlestick forms with a long body and little to no shadow. This signals strong movement in one direction, which will likely continue movement in that direction in the near future. In the bullish Maruboza case, the opening price is equal to the low and the closing price is equal to the high. With a bearish Maruboza the opening price is the high and the closing is the low.
Doji
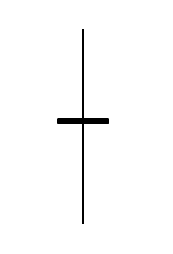
A doji is a candlestick where the opening price is almost the exact same as the opening price, with long shadows in one direction or both. What this can signal is indecision between buyers and sellers. If these occur at the top or bottom of a trend it can signal a reversal as it shows a slowing of momentum.
Hammer
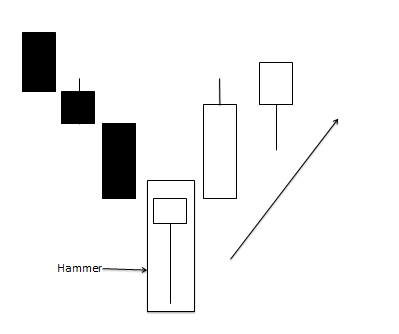
The hammer chart pattern is a Japanese candlestick that has a small body with a short to no shadow on top of the body with a long shadow on the bottom. When this candlestick occurs at the bottom of a trend, it can signal for a reversal.
Hanging Man
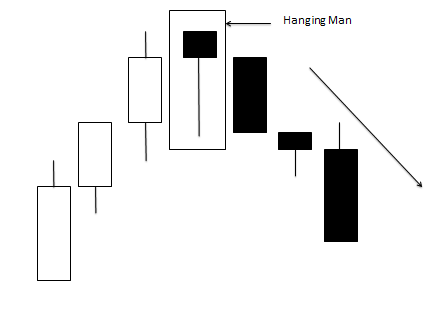
The hanging man candlestick pattern has the exact same candlestick as the hammer but has different price action before it, so it signals for a reversal downwards.
Inverted Hammer
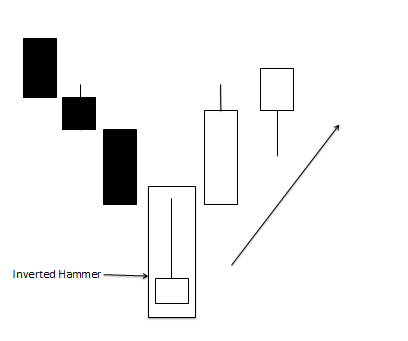
The inverted hammer is a candlestick similar to the hammer and hanging man patterns in that it can signal a reversal. With an inverted hammer, a small bullish candlestick body forms with a long shadow on top, and occurs during a downtrend.
The reason this signals a possible reversal is because of an inability of the bears to force the price below the close after a strong effort by the bulls. The shortage of sellers is a signal for a change towards upward momentum.
Shooting Star
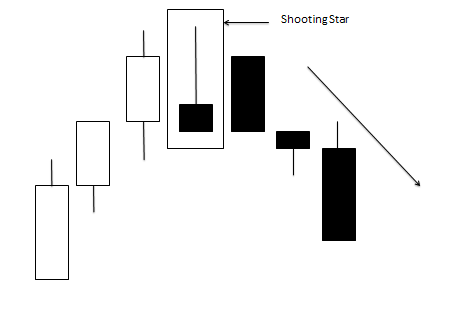
The shooting star is similar to the inverted hammer but occurs during an uptrend and can signal a reversal downwards. The candlestick for a shooting star is a small bearish body with a long shadow on top.
The reason behind the reversal in strength is that the bears out strengthened the bulls after a strong push by the bulls. When this occurs during an uptrend it signifies a change in momentum downwards.
The views and opinions expressed herein are the views and opinions of the author and do not necessarily reflect those of Nasdaq, Inc.