
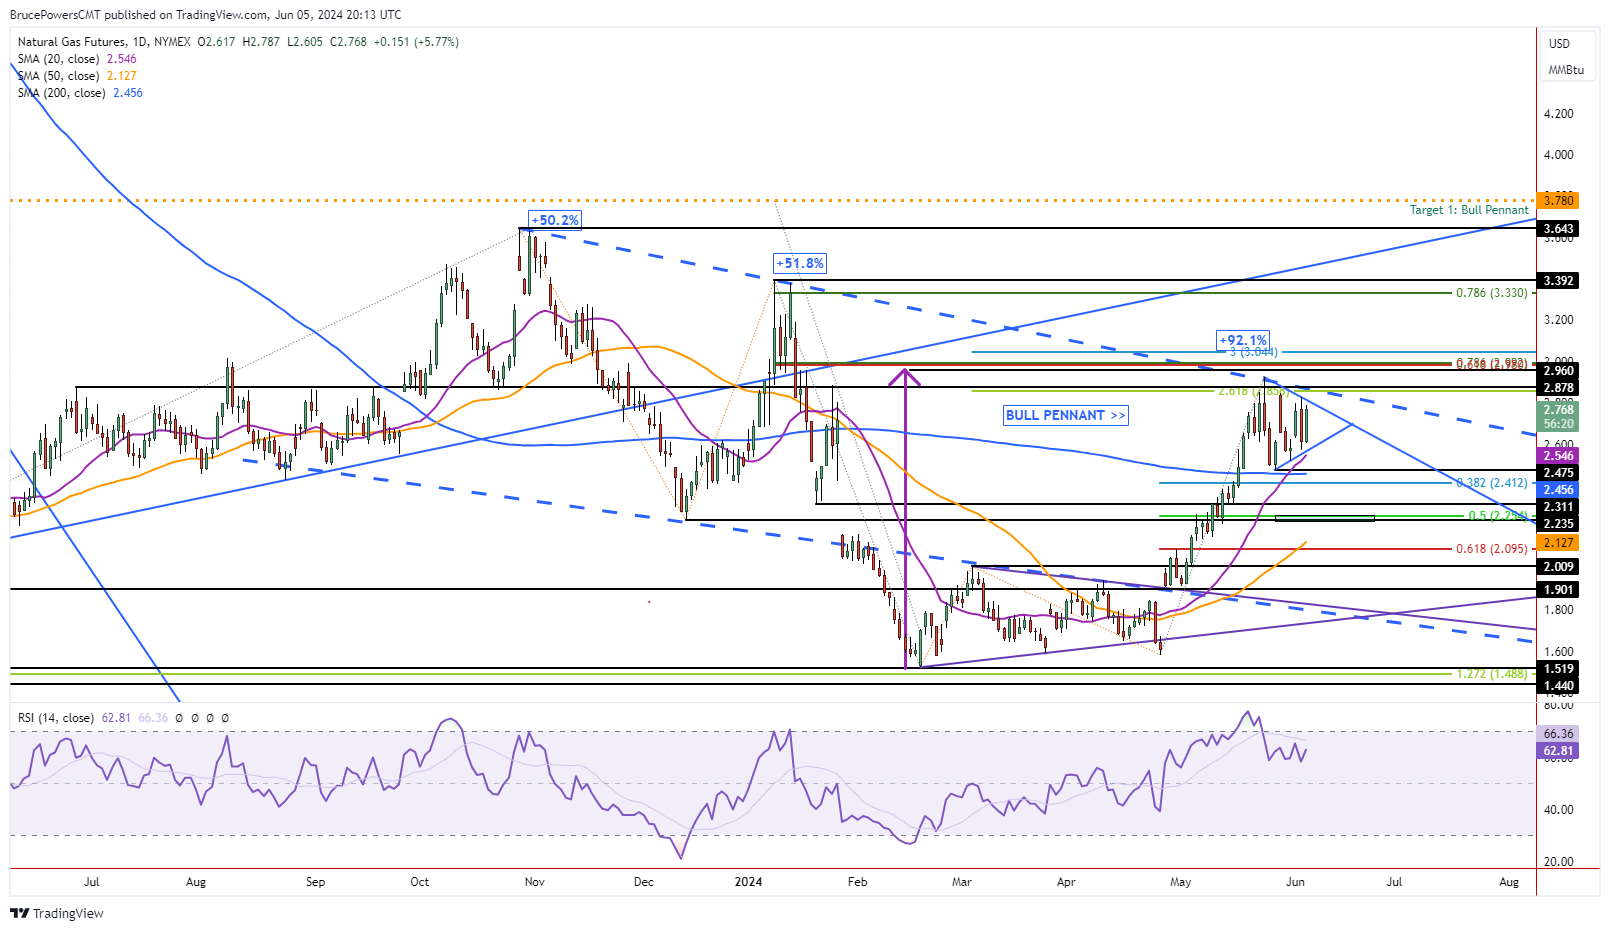
Natural gas further traces out a bull pennant trend continuation pattern on Wednesday, as it traded inside Tuesday’s trading range. This pattern is forming on support of both the 20-Day MA and 200-Day MAs. The range of the pennant is tightening as natural gas gets closer to the apex of the pattern on June 17. This means that a bullish breakout or bearish pattern failure from the pennant will happen by then.
Upside Breakout Triggers Above 2.83
An upside breakout of the pennant is indicated on a decisive rally above yesterday’s high of 2.83. Once the recent trend high of 2.92 is broken to the upside, a bullish breakout of the declining trend channel will also occur. If that happens, the prior swing high of 3.39 becomes the next higher target, followed by the 2023 peak at 3.64. Higher up is the target derived from the measuring objective of the pennant pattern. Its target is 3.78.
Strong Bullish Position
The pennant pattern is in an interesting position, holding support of the 20-Day and 200-Day MAs, while further testing resistance at the top trendline. It has the potential to lead to an explosive rally in natural gas. The pullback from the recent trend high has been minor, not even reaching the 38.2% Fibonacci retracement.
This is a sign of strength as buyers could have been waiting for lower prices to get more aggressive. As the price of natural gas consolidates within the pennant pattern it is building up energy for the next swing. The 0.95-point rally prior to the consolidation left a clue as to what may come next. Typically, a bull flag has the potential to match or exceed the rally prior to the consolidation pattern occurring.
Lower Support Levels
On the downside, maintaining support above the 20-Day MA, currently at 2.545, is key to the current environment. The 20-Day MA showed strength recently as it rose above the 200-Day line recently after being below it since February 2. Notice that the 20-Day line is close to converging with the bottom boundary line of the pennant pattern. Following lower interim support levels being tested, natural would likely be headed towards an eventual test of support around 2.25 to 2.23. That first level is the 50% retracement.

For a look at all of today’s economic events, check out our economic calendar.
This article was originally posted on FX Empire
More From FXEMPIRE:
- Nasdaq Index, Dow Jones, S&P 500 News: Nvidia Leads Tech Rally Ahead of NFP Report
- Major Commodities Gain Ahead of the NFP
- Bitcoin Price Forecast – Bitcoin Continues to See Support
The views and opinions expressed herein are the views and opinions of the author and do not necessarily reflect those of Nasdaq, Inc.

