
Natural gas breaks up and out of a bull pennant pattern today with a rally above Tuesday’s 2.83 high. Resistance was seen near the top trendline with a high of 2.88 at the time of this writing. Today was the second test of resistance at the trendline. Natural gas is on track to close weak however, in the bottom half of the day’s range.
This would question the sustainability of the pennant breakout. Next, watch for bullish confirmation with a continuation above today’s high or a drop below the low. The low is currently at 2.72. If natural gas does not close in a strong position, the potential to dip back into the consolidation pattern increases.
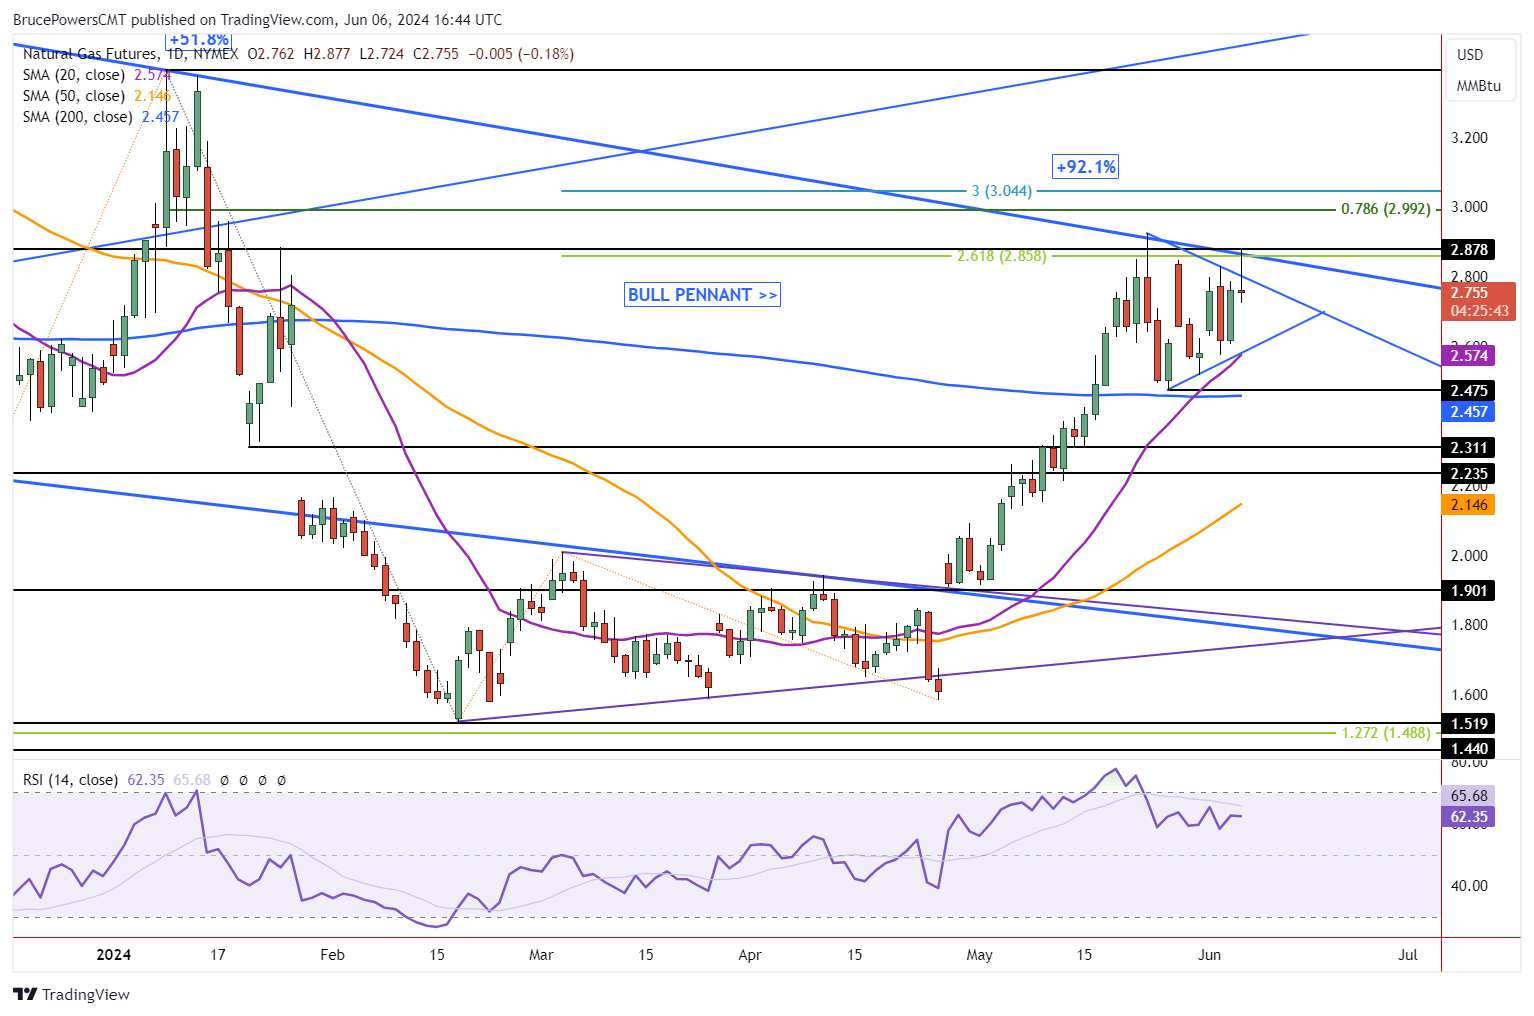
Recent Peak of 2.92 Up Next?
The most recent trend high was at 2.92. If the bull trend continues that high should be easily exceeded. Whether the price of natural gas can continue to climb following a trendline break remains to be seen. But so far it is off to a good start. Following Thursday’s close, a daily close above today’s high will confirm the trendline breakout and a daily close above 2.92 confirms a continuation of the bull trend. Nonetheless, even if the progression higher stalls after a trendline breakout, if natural gas stays above the trendline, a continuation higher is the most likely scenario, unless there is a drop through trendline support.
Watching for Further Confirmation of Strength
After a confirmed trend continuation signal with a daily close above 2.92 natural gas would next be targeting two prior swing highs. The first is at 3.39 and the second is 3.64. That top target was the peak for 2023. That peak in October 2023 at 3.64 completed an 87.2% advance from the 1.95 swing low from April of last year. The current rally has already exceeded that advance on a percentage basis as it was up by 92.1% at the recent trend high of 2.92.
20-Day MA is Near-Term Support at 2.58
Regardless of the bull pennant breakout, until there is further confirmation of strength a failure remains a possibility. Key near-term support is at the 20-Day MA at 2.58. It happens to have converged with the lower boundary line of the pattern today and therefore each line identifies a similar support area. Below the 20-Day line is the 200-Day MA at 2.46. It has already been successfully tested once as support and should do so again.
For a look at all of today’s economic events, check out our economic calendar.
This article was originally posted on FX Empire
More From FXEMPIRE:
- GameStop (GME) Memecoin Risks 80% Crash After Keith Gill’s YouTube Livestream
- The Market News Today: Investors Await Jobs Report for Fed Insights
- US Dollar (DXY) Index News: Treasury Yields, Greenback Climb on Robust Payroll Data
The views and opinions expressed herein are the views and opinions of the author and do not necessarily reflect those of Nasdaq, Inc.

