Nasdaq Index Performance: May 2023
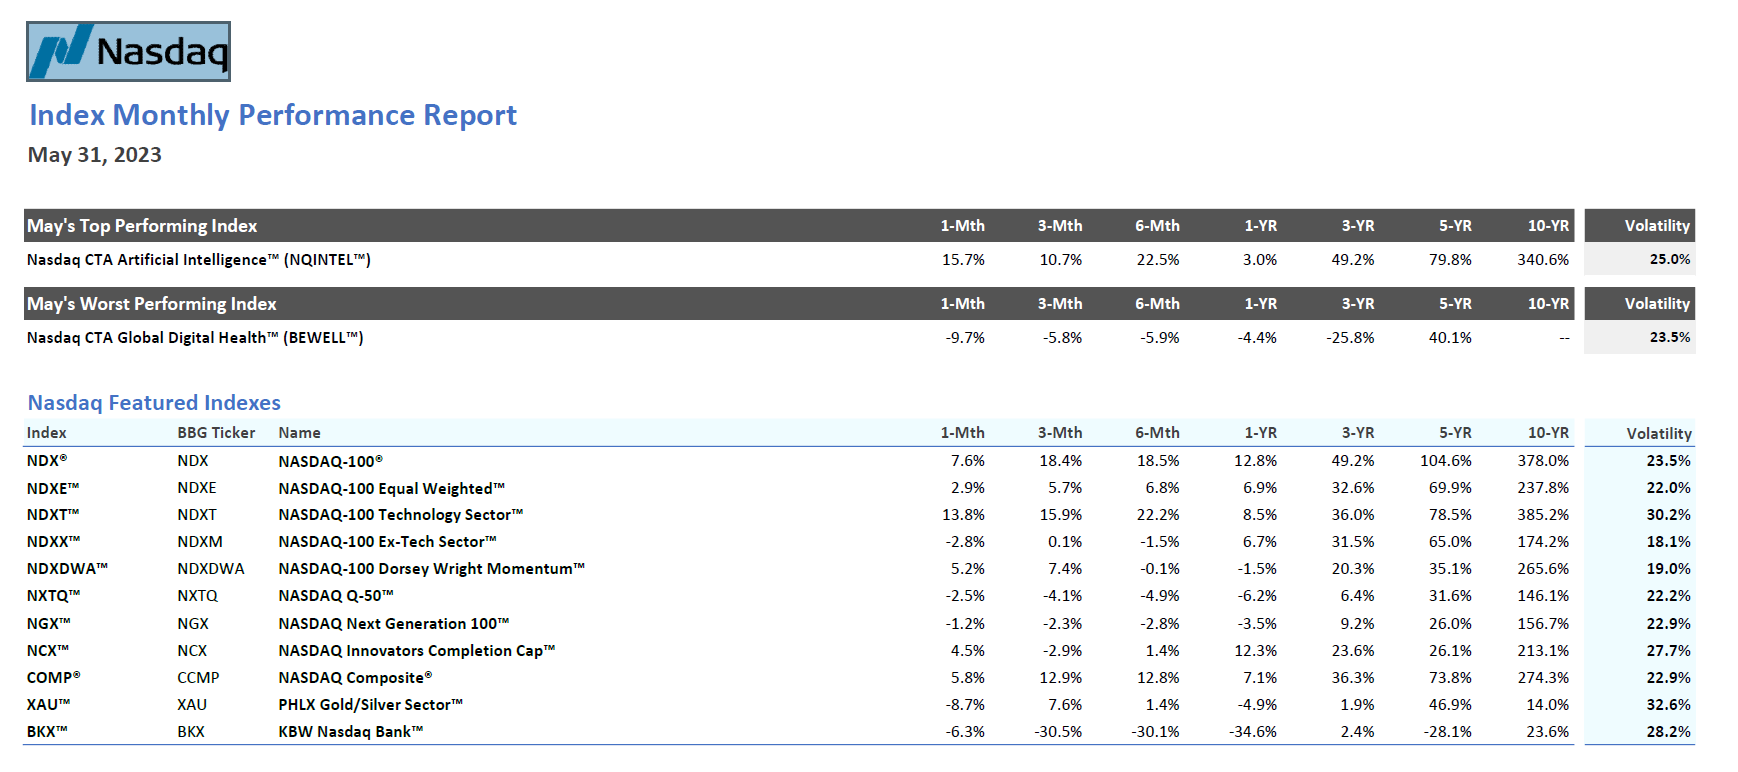
Performance for the month of May was another mixed bag. Across the 106 indexes tracked in this report, 41 indexes finished in positive territory, while 65 finished in negative territory. The Nasdaq-100® (NDX®) gained 7.6%, while the Nasdaq Composite® (COMP™) gained 5.8%, significantly outperforming the average return of -0.2% across all 106 indexes tracked in this report. Overall, the best-performing index was the Nasdaq-100 Technology Sector™ (NDXT™), which gained 13.8%. On the other hand, the worst-performing index was the PHLX Gold/Silver Sector™ (XAU™), which fell 8.7%. Generally speaking, there was a theme of strength across thematic technology-related indexes, particularly from artificial intelligence (AI), which offset weakness in other areas, including the dividend and income suite of indexes, the thematic ESG indexes, and the lineup of Nasdaq Global Indexes.
Within the Nasdaq Featured Index lineup, the Nasdaq-100 Technology Sector™ (NDXT™) was the best-performing index, gaining 13.8%, while the worst-performing index was the PHLX Gold/Silver Sector™ (XAU™), down 8.7%. Other indexes that finished the month of May in positive territory include the Nasdaq-100 (NDX), the Nasdaq-100 Equal Weighted™ (NDXE™), the Nasdaq Innovators Completion Cap™ (NCX™), and the Nasdaq Composite (COMP). The KBW Nasdaq Bank™ (BKX™) was down 6.3% this month, as there continued to be concerns among investors about the banking system and its vulnerability to bank runs. The Nasdaq Featured Index lineup was up 1.7% on average, an improvement over the previous month.
All but one index within the Nasdaq Global Index line-up came under pressure in the month of May. The suite of indexes finished with an average loss of 2%, with the worst-performing index being the Nasdaq Europe™ (NQEU™) which fell 6.4%. Concerns about a global slowdown on the heels of China’s weak economic data and uncertainty surrounding the U.S. debt ceiling weighed on Europe. The Nasdaq US Large Cap™ (NQUSL™) managed to gain 0.8%, emerging as the sole outperformer within the Global lineup. The performance differential between Nasdaq Developed Markets™ (NQDM™) and Nasdaq Emerging Markets™ (NQEM™) was limited.
The Nasdaq Nordic OMX Indexes ended the month in red, averaging a loss of 2.9%, down from its average gain of 1% in April. The OMX Helsinki 25® (OMXH25™) was down 6% and was the relative underperformer, while the OMX Copenhagen 25™ (OMXC25™) was down 0.9% and was the relative outperformer within the suite of Nasdaq Nordic OMX Indexes.
The Nasdaq Thematic Tech Indexes ended the month with an average gain of 5%, reversing its loss of 2.4% from the previous month. Fueled by AI optimism, the Nasdaq CTA Artificial Intelligence™(NQINTEL™) ended the month as the top performer, up 15.7%. Gains were not limited to artificial intelligence-related indexes but extended to Semiconductors, Cybersecurity, Cloud computing, and Big Data. The PHLX Semiconductor™ (SOX™) was up 15.3%. At the same time, the BVP Nasdaq Emerging Cloud™ (EMCLOUD™), ISE CTA Cloud Computing™ (CPQ™), ISE Cyber Security UCITS™ (HUR™), Nasdaq CTA Cybersecurity™ (NQCYBR™) and Nasdaq Yewno Global AI and Big Data™ (NYGBIG™) posted solid double-digit gains. Healthcare-related indexes, which posted robust returns in the month of April, saw their gains reverse in May, with the Nasdaq CTA Global Digital Health™ (BEWELL™) down 9.7%, declining the most.
The Nasdaq Thematic ESG indexes were down 2.6% on average. The Nasdaq Clean Edge Green Energy™ (CELS™) was up 6.6%, emerging as the top performer while the Nasdaq Sprott Junior Copper Miners™ (NSCOPJ™) was down 12%, emerging as the relative underperformer.
The Nasdaq Dorsey Wright suite ended the month with an average loss of 2.5%. Only two out of 16 indexes finished May in positive territory, with the Dorsey Wright Technology Tech Leaders™ (DWTY™) emerging as the top performer, up 13.6%. Additionally, the Dorsey Wright SmallCap Tech Leaders™ (DWATLSC™) managed to post relatively modest gains of 0.8%. The Dorsey Wright Energy Tech Leaders™ (DWEN™) and the Dorsey Wright Consumer Cyclicals Tech Leaders™ (DWCC™) were the relative laggards, down 8.3% and 7.3%, respectively.
The Nasdaq Dividend and Income suite of indexes ended the month with an average loss of 3.9%. The Nasdaq US Dividend Achievers 50™ (DAY™) was the relative laggard, down 8.7% while the Nasdaq 7HANDL™ (NQ7HANDLL™) was the relative outperformer, down 2%.
Similar to what transpired in April, the Nasdaq Options Indexes ended the month with an average gain of 1.0%. The Credit Suisse Nasdaq WTI Crude Oil FLOWS 106 TR™ (QUSOITR™) the relative underperformer, down 8.9% within the suite while the Nasdaq-100 Quarterly Protective Put 90™ (NQTRI™) was the relative outperfomer, up 7.5%.
The Nasdaq Green Economy Indexes finished the month of May with an average gain of 0.7%, a significant improvement over the previous month’s return. The top-performer was the Nasdaq OMX Solar™ (GRNSOLAR™) up 4.8%, reversing its weakness seen in April. The Nasdaq OMX Global Water™ (GRNWATERL™) was down 3.2%, emerging as the relative underperformer.
The Nasdaq Crypto Indexes were down 5.2% on average in the month of May. The Nasdaq Bitcoin™ (NQBTCS™) fell 7.5%, emerging as the relative underperformer, while the Nasdaq Crypto Index Europe™ (NCIES™) was down 5.7%, emerging as the relative outperformer.
The Nasdaq-100 recorded a third consecutive month of gains and is now up 30.3% for the year. A wave of interest in AI has contributed to recent gains, pointing to continued overall strength of the index in the face of market headwinds. The outlook for the overall market remains cautious due to several unknowns that continue to weigh on the minds of market participants, including a potential “hawkish pause” from the Federal Reserve, continued geopolitical tensions, and lingering effects of the banking crisis. On a rolling one-year basis, the Nasdaq-100 is up 12.8%.
Disclaimer:
Nasdaq® is a registered trademark of Nasdaq, Inc. The information contained above is provided for informational and educational purposes only, and nothing contained herein should be construed as investment advice, either on behalf of a particular security or an overall investment strategy. Neither Nasdaq, Inc. nor any of its affiliates makes any recommendation to buy or sell any security or any representation about the financial condition of any company. Statements regarding Nasdaq-listed companies or Nasdaq proprietary indexes are not guarantees of future performance. Actual results may differ materially from those expressed or implied. Past performance is not indicative of future results. Investors should undertake their own due diligence and carefully evaluate companies before investing. ADVICE FROM A SECURITIES PROFESSIONAL IS STRONGLY ADVISED.
© 2023. Nasdaq, Inc. All Rights Reserved.
The views and opinions expressed herein are the views and opinions of the author and do not necessarily reflect those of Nasdaq, Inc.

Nasdaq Index Research Team
Nasdaq
Nasdaq calculates more than 40,000 diverse indexes, providing coverage across asset classes, countries and sectors.
Read Nasdaq Index Research Team's Bio