Nasdaq Index Performance: July 2023
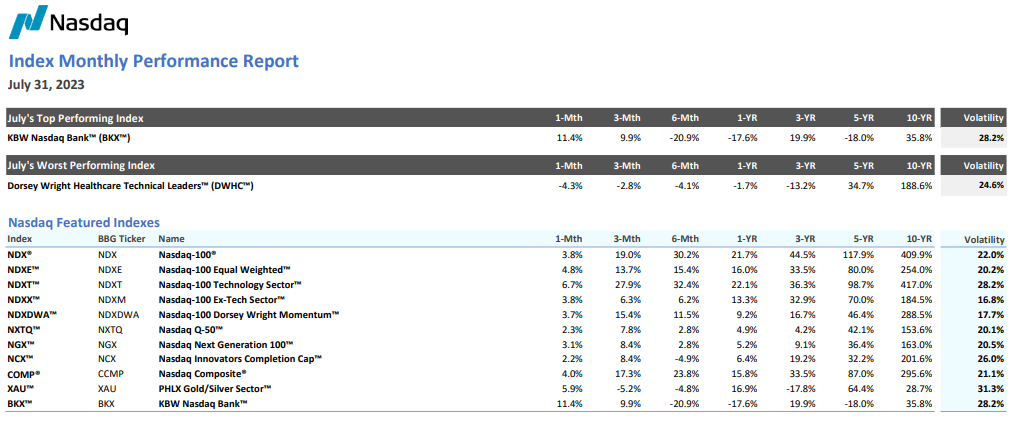
Performance was mostly positive for the month of July across the 107 indexes tracked in this report, as 87% finished in positive territory while the remaining 13% ended the month in the red. The average return across all 107 indexes was 3.4%. The Nasdaq-100® (NDX®) gained 3.8%, extending its fifth consecutive month of positive returns. The best-performing index was the KBW Nasdaq Bank™ (BKX™), which gained 11.4%. On the other hand, the worst-performing index was the Dorsey Wright Healthcare Technical Leaders™ (DWHC™), as it fell -4.3%. Overall, there was a theme of strength across technology-related areas, specifically Artificial Intelligence, as well as strength in US small and mid-cap stocks. International-focused indexes also proved to be outperformers in July, particularly those related to emerging markets, such as the Dorsey Wright Emerging Markets Technical Leaders™ (DWAEM™). In terms of weakness, indexes related to healthcare and crypto proved to be the laggards over the last 31 days.
Within the Nasdaq Featured Index lineup, the KBW Nasdaq Bank™ (BKX™) outshined its peers with a double-digit return of 11.4%. Other outperformers included the Nasdaq-100 Technology Sector™ (NDXT™) and the PHLX Gold/Silver Sector™ (XAU™), which gained 6.7% and 5.9%, respectively. Although it gained 2.2% for the month, the relative laggard of the group was the Nasdaq Innovators Completion Cap™ (NCX™).
The Nasdaq US Small Cap™ (NQUSS™) was the best-performing of the nine Nasdaq Global Indexes, finishing up 6.4%, while the second best performing, the Nasdaq Emerging Markets™ (NQEM™), gained 5.2%. Additionally, the Nasdaq US Mid Cap™ (NQUSM™) gained 4.4%, while the Nasdaq US Large Cap™ (NQUSL™) gained 3.2%. On average, the Nasdaq Global Index lineup gained 4.2%.
It was a relatively negative month across the five indexes that make up the Nasdaq OMX Nordic Index suite. The one index that managed to finish in positive territory was the OMX Nordic 120™ (NOMXN120™), rising 0.5%. The laggard of the group was the OMX Stockholm 30™ (OMXS30™), down -2.6%.
Artificial Intelligence dominated within the suite of Nasdaq Thematic/Tech Indexes in July. The Nasdaq CTA Artificial Intelligence™ (NQINTEL™) was the top-performing across the suite, gaining 10.0%. The next best-performing index in July was the BVP Nasdaq Emerging Cloud™ (EMCLOUD™), followed by the Nasdaq CTA Internet™ (QNET™). The worst-performing index in the thematic lineup was the Nasdaq Global Disruptive Tech™ (NYDTB™), which fell -1.2%.
The relative-strength driven suite of Nasdaq Dorsey Wright Indexes was led by the Dorsey Wright Energy Technical Leaders™ (DWEN™) with a gain of 11.3%, while the Dorsey Wright Healthcare Technical Leaders™ (DWHC™) was the worst-performing of the 16 relative-strength-driven indexes with a loss of 4.3%. The Dorsey Wright Financials Technical Leaders™ (DWFN™) gained 9.6% in July, followed by the Dorsey Wright Consumer Cyclicals Technical Leaders™ (DWCC™), which rose 5.9%. On average, the Nasdaq Dorsey Wright index gained 4.4% in July.
All of the Nasdaq Dividend and Income Indexes shown were up for the month of July, led by the Nasdaq US SMID Cap Rising Dividend Achievers™ (NQDVSMR™), up 6.9%, as well as the Nasdaq International Buyback Achievers™ (DRBXUS™), up 5.3%. The Nasdaq Select Canadian Dividend™(NQCADIV™) was the relative laggard of the group, gaining 0.9%.
For the second consecutive month, the nine indexes within the Nasdaq Options Suite finished in the black with an average gain of 4.2%. The Credit Suisse Nasdaq WTI Crude Oil FLOWS106 TR™ (QUSOITR™) was the top performer of the group with a return of 10.2%, followed by the Credit Suisse Nasdaq Silver FLOWS106 TR™ (QSLVOTR™), up 8.6%.
The suite of Nasdaq Thematic ESG Indexes was led by the Nasdaq Sprott Junior Copper Miners™ (NSCOPJ™) (9.7%), followed by the Nasdaq Clean Edge Green Energy™ (CELS™). The worst performing thematic ESG index in July was the Nasdaq Sprott Lithium Miners™ (NSLITP™), slipping 3.7%.
The Nasdaq Green Economy Indexes finished mostly higher for the month of July, led by the Nasdaq OMX Global Water™ (GRNWATERL™), which gained 3.3%. The worst-performing index was the Nasdaq OMX Wind™ (GRNWND™), falling -1.7%.
Finally, all four of the Nasdaq Crypto Indexes moved lower over the last month with an average return of -2.8%. The worst-performing of the group was the Nasdaq Bitcoin™ (NQBTCS™), while the relative leader was the Nasdaq Crypto Index Europe™ (NCIES™), which posted respective losses of -3.8% and -0.8%.
The Nasdaq-100 recorded a fifth consecutive month of gains in July and is now up over 44% for the year. Overall, the outlook for the market remains relatively cautious due to several uncertain macro factors, including whether inflation will continue to moderate and just how long rates will remain elevated. Additionally, the market continues to face geopolitical tensions. Advancements in Artificial Intelligence remains front and center on investors minds and continues to be a major driver for the greater technology sector. On a rolling one-year basis, the Nasdaq-100 is up 21.7%.
Disclaimer:
Nasdaq® is a registered trademark of Nasdaq, Inc. The information contained above is provided for informational and educational purposes only, and nothing contained herein should be construed as , either on behalf of a particular security or an overall investment strategy. Neither Nasdaq, Inc. nor any of its affiliates makes any recommendation to buy or sell any security or any representation about the financial condition of any company. Statements regarding Nasdaq-listed companies or Nasdaq proprietary indexes are not guarantees of future performance. Actual results may differ materially from those expressed or implied. Past performance is not indicative of future results. Investors should undertake their own due diligence and carefully evaluate companies before investing. ADVICE FROM A SECURITIES PROFESSIONAL IS STRONGLY ADVISED.
© 2023. Nasdaq, Inc. All Rights Reserved.
The views and opinions expressed herein are the views and opinions of the author and do not necessarily reflect those of Nasdaq, Inc.

Nasdaq Index Insights Team
Nasdaq
Nasdaq calculates more than 40,000 diverse indexes, providing coverage across asset classes, countries and sectors.
Read Nasdaq Index Insights Team's Bio