Since Oct 2018, when we published the first research piece to measure the liquidity of Nasdaq-100 Index Options (NDX), the value of the Nasdaq-100 Index (NDX) has more than doubled. A single contract is now over $1.1m in notional value and warrants an update to understand the transaction costs of trading NDX index options. Due to the complexity of measuring liquidity, we will first explain our methodology.
We examined options execution data to illuminate average execution slippage or effective spread to provide guidance and transparency. Products such as the NDX index options with large option chains are most susceptible to a perceived lack of liquidity due to wide quoted bid/ask spreads. We evaluated over 32,000 executions of NDX for the average execution price with respect to the midpoint. We found that over 63% of volume traded with an effective spread of under 1% away from the midpoint, showing deep liquidity and low transaction costs, even if traditional liquidity metrics may suggest otherwise.
Options Slippage
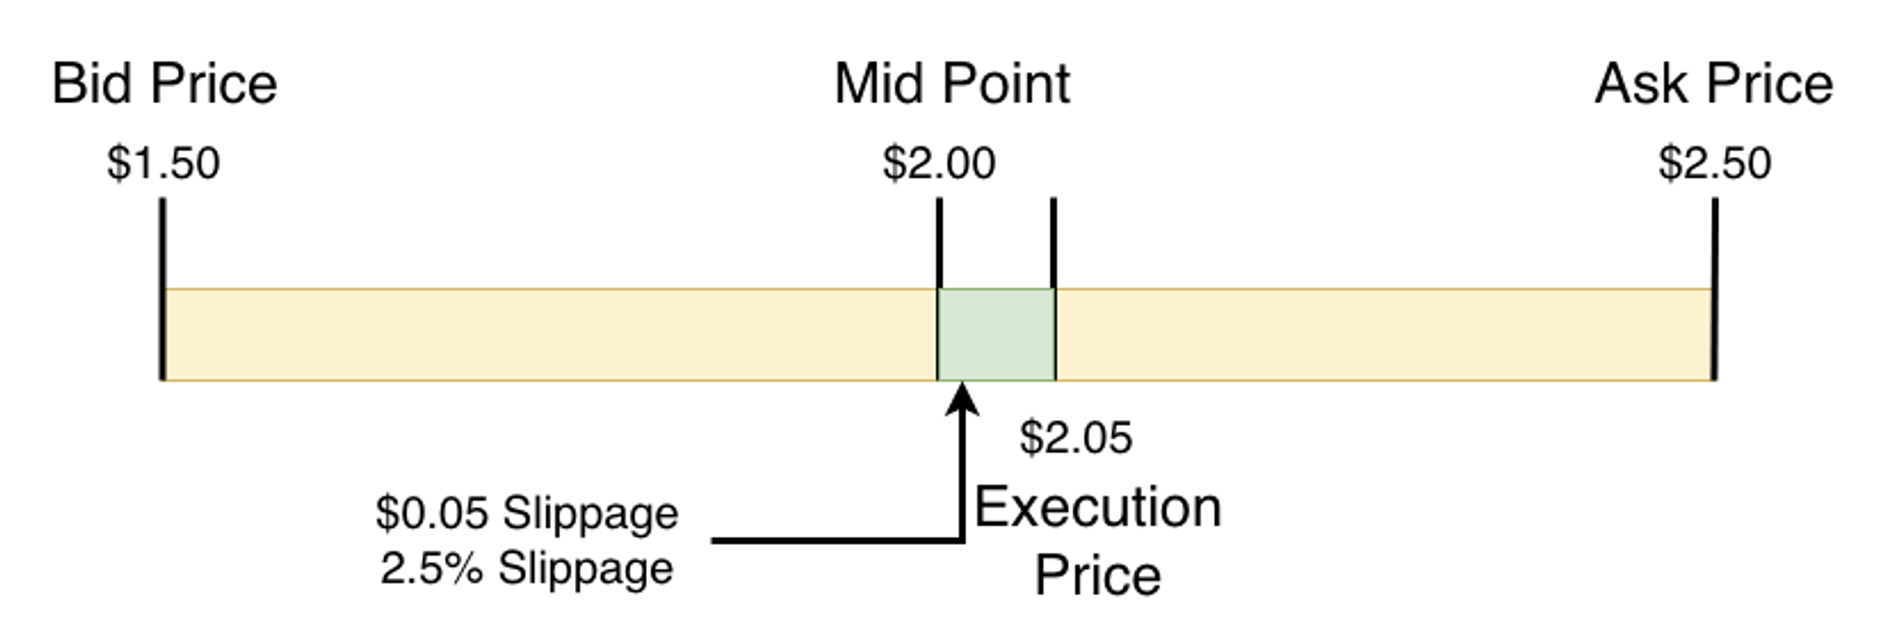
Before diving into metrics, we first want to define how we measured our findings. We define slippage as the distance between the execution price and the mid-point of an option, otherwise known as the effective spread. Small effective spreads correlate to better liquidity, if effective spreads widen, that speaks to worsening liquidity. Traders want to see orders filled as close to the midpoint as possible to minimize transaction costs and improve profits. With this metric, we can measure changes in the liquidity of NDX index options by analyzing where trades are filled with respect to this midpoint. We calculate slippage in both dollar and percentage terms in the example below.
Bid/Ask Spread: $2.50 (Ask Price) - $1.50 (Bid Price) = $1.00 Spread
Effective Spread: $2.05 (Execution Price) - $2.00 (Midpoint) = $0.05 Slippage
Slippage in percentage: $0.05 (Slippage) / $2.00 (Midpoint) = 2.5% Slippage
Perception of Liquidity
Many traders will utilize bid/ask spreads and open interest (OI) to gauge an option's liquidity; however, we have found many cases where these metrics are poor indicators. While it is true that options with high OI and volume typically translate to deep liquidity, the opposite is not always true. There are many reasons that an option with zero or low OI and volume is very liquid and will be executed within pennies of the midpoint. Furthermore, the spread between the bid/ask quote is arguably a better liquidity metric for most options, but even this has its exceptions. We have found very little correlation between slippage and the bid/ask spread size. However, examining actual executions of trades and liquidity can be measured by the ability of large orders to be bought and sold near the midpoint.
Liquidity Metrics
These findings lead us to focus on the metric that impacts your trading bottom line, slippage. As stated in the summary, the average execution traded only 4.49 % away from the midpoint. Moreover, the average slippage in dollar terms was $0.44 per contract. That translates to a slippage of $106 on a $1,250,000 contract or 0.00008%. However, this number was misleading as we dug deeper. The bulk of the volume and large trades were executed at far better prices. Moreover, 19.66% of executions are filled at the midpoint! We summarize our findings on slippage with the factors that affect liquidity, contract size, option price, and delta to help provide research on where orders are filled. Our research shows that NDX has much deeper liquidity than what is displayed on the screens.
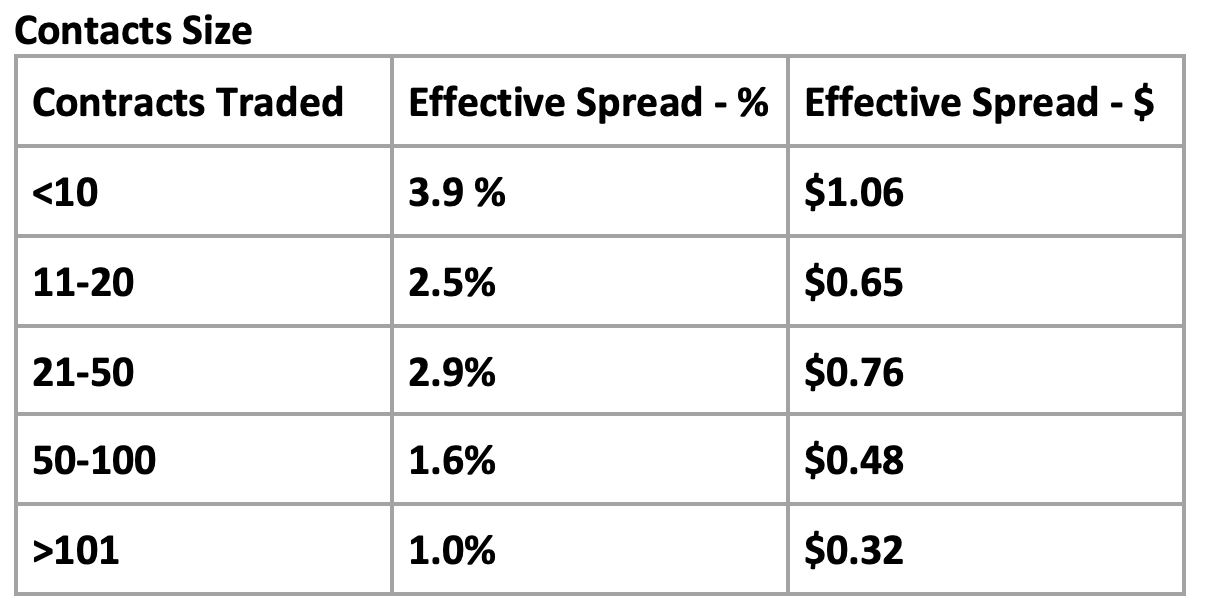
Our findings, based on contract size, show that liquidity seems to improve for larger trades when measured by the Effective Spread in % terms. However, when viewing this from the Effective Spread in $ terms, we see that the Effective Spread is smaller for smaller contract-sized trades. This can be explained by our next table, which analyzes the effective spread based on options price. We found that smaller contract trades in NDX were also lower options premium trades, which will see a higher percentage Effective Spread, but still provide a lower transaction cost in absolute $ terms. Moreover, even trades of over $100m in notional value in a single execution were filled at an Effective Spread under 1%, showing the true deep liquidity of the NDX product.
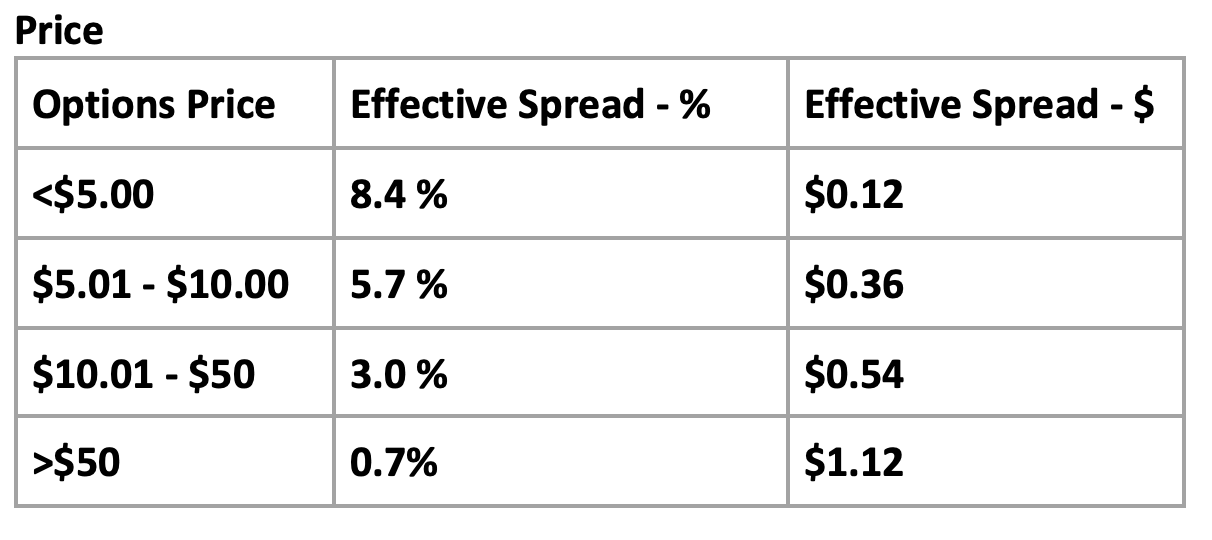
The price of an option is a significant factor in the slippage of order executions. An index valued at over $12,500 will create option prices that are sizable. Naturally, options with a higher options premium will have a very low Effective Spread measured in % terms. However, we found that options premiums that were priced 10 times higher did not have Effective Spreads that were 10 times higher. This shows that options with high premiums received better execution quality over trades with lower premiums.
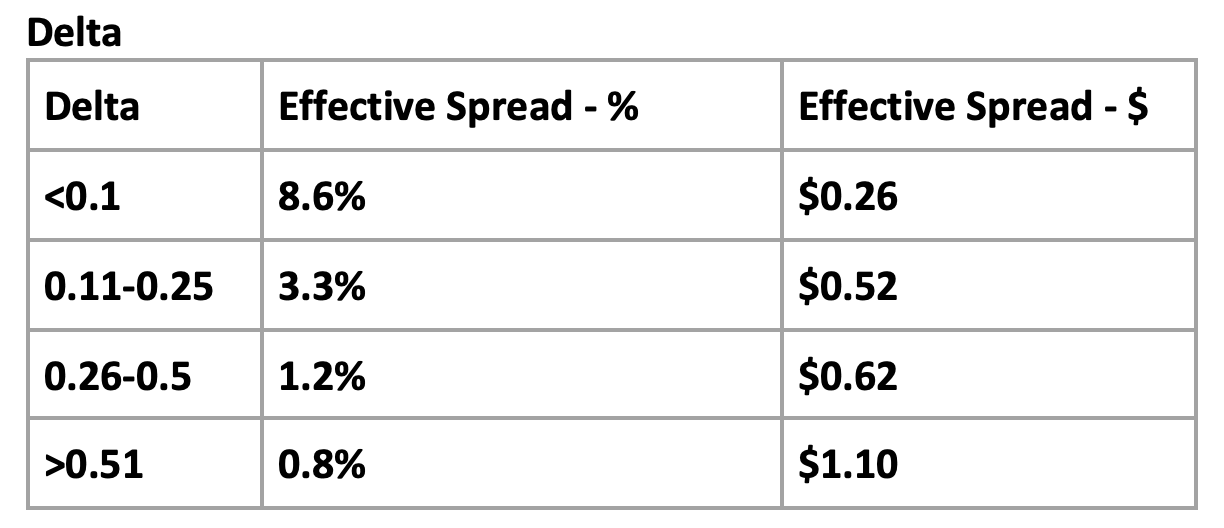
When we reviewed the data sliced by the options Greek delta, it follows a similar trend as price. Options that have a low delta (far away from the current price) typically will see higher Effective Spreads. One of the most popular index options strategies, credit spreads, typically uses options with low deltas. Our data shows that slippage increases as a percentage of the execution price at these extremes. But the Effective Spread measured in dollar terms is well below average and shows strong execution quality for these types of trades.
In conclusion, we find that despite lower open interest, volumes, and wider bid/ask spreads, which may advertise a lack of liquidity, the reality is quite the opposite. There is a deep pool of liquidity available on Nasdaq-100 Index options. This knowledge seems to reflect institutional traders who execute large volumes within 1% of the midpoint but less so from retail traders. Furthermore, credit spread sellers will find better liquidity by removing slightly higher up the deltas, and higher-priced options provide better liquidity. Lastly, our data shows that 74.76% of orders executed were filled within 2% of the mid-point. This crucial data point is how traders can use the midpoint and execution data to inform decisions on placing limit orders with NDX.
The views and opinions expressed herein are the views and opinions of the author and do not necessarily reflect those of Nasdaq, Inc.

Tony Zhang
Tony Zhang is a specialist in the financial services industry with over a decade of experience spanning product development, research and market strategist roles across equities, foreign exchange and derivatives. As the current Chief Strategist for OptionsPlay, Tony currently leads the research and development of their OptionsPlay Ideas & Portfolio platform. He has leveraged his interest in financial technology and product development to provide innovative reimagined solutions to clients and the users they seek to serve. Previously, he spent 7 years at FOREX.com with a capital markets and research background as a market strategist specializing in equity and FX derivatives markets.
Read Tony's Bio