
Taiwan Semiconductor (NYSE:TSM) is gearing up to announce its quarterly earnings on Thursday, 2025-04-17. Here's a quick overview of what investors should know before the release.
Analysts are estimating that Taiwan Semiconductor will report an earnings per share (EPS) of $1.82.
The announcement from Taiwan Semiconductor is eagerly anticipated, with investors seeking news of surpassing estimates and favorable guidance for the next quarter.
It's worth noting for new investors that guidance can be a key determinant of stock price movements.
Overview of Past Earnings
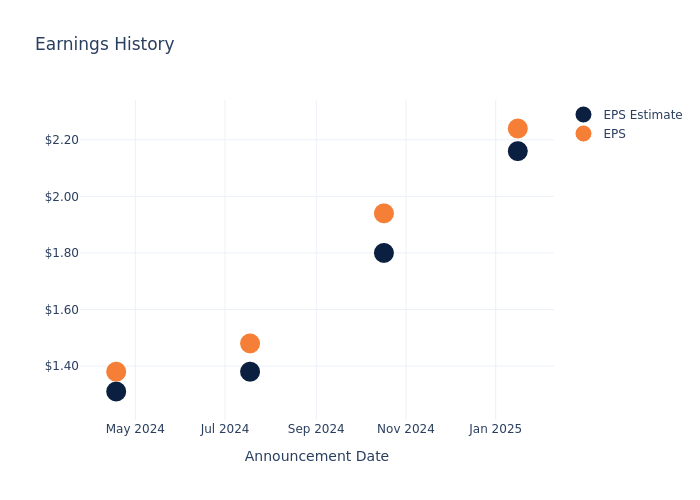
During the last quarter, the company reported an EPS beat by $0.08, leading to a 1.53% drop in the share price on the subsequent day.
Here's a look at Taiwan Semiconductor's past performance and the resulting price change:
| Quarter | Q4 2024 | Q3 2024 | Q2 2024 | Q1 2024 |
|---|---|---|---|---|
| EPS Estimate | 2.16 | 1.80 | 1.38 | 1.31 |
| EPS Actual | 2.24 | 1.94 | 1.48 | 1.38 |
| Price Change % | -2.0% | -2.0% | -4.0% | -3.0% |
Tracking Taiwan Semiconductor's Stock Performance
Shares of Taiwan Semiconductor were trading at $157.33 as of April 15. Over the last 52-week period, shares are up 14.45%. Given that these returns are generally positive, long-term shareholders are likely bullish going into this earnings release.
Analyst Observations about Taiwan Semiconductor
For investors, grasping market sentiments and expectations in the industry is vital. This analysis explores the latest insights regarding Taiwan Semiconductor.
A total of 3 analyst ratings have been received for Taiwan Semiconductor, with the consensus rating being Buy. The average one-year price target stands at $235.0, suggesting a potential 49.37% upside.
Comparing Ratings with Competitors
The analysis below examines the analyst ratings and average 1-year price targets of Advanced Micro Devices, Qualcomm and Texas Instruments, three significant industry players, providing valuable insights into their relative performance expectations and market positioning.
- Analysts currently favor an Outperform trajectory for Advanced Micro Devices, with an average 1-year price target of $148.95, suggesting a potential 5.33% downside.
- Analysts currently favor an Buy trajectory for Qualcomm, with an average 1-year price target of $188.62, suggesting a potential 19.89% upside.
- Analysts currently favor an Neutral trajectory for Texas Instruments, with an average 1-year price target of $208.89, suggesting a potential 32.77% upside.
Peer Metrics Summary
The peer analysis summary outlines pivotal metrics for Advanced Micro Devices, Qualcomm and Texas Instruments, demonstrating their respective standings within the industry and offering valuable insights into their market positions and comparative performance.
| Company | Consensus | Revenue Growth | Gross Profit | Return on Equity |
|---|---|---|---|---|
| Broadcom | Outperform | 24.71% | $10.14B | 8.01% |
| Advanced Micro Devices | Outperform | 24.16% | $3.88B | 0.84% |
| Qualcomm | Buy | 17.45% | $6.51B | 11.97% |
| Texas Instruments | Neutral | -1.72% | $2.31B | 7.02% |
Key Takeaway:
Taiwan Semiconductor ranks at the top for Revenue Growth and Gross Profit among its peers. It is in the middle for Return on Equity.
All You Need to Know About Taiwan Semiconductor
Taiwan Semiconductor Manufacturing Co. is the world's largest dedicated chip foundry, with over 60% market share. TSMC was founded in 1987 as a joint venture of Philips, the government of Taiwan, and private investors. It went public as an ADR in the us in 1997. TSMC's scale and high-quality technology allow the firm to generate solid operating margins, even in the highly competitive foundry business. Furthermore, the shift to the fabless business model has created tailwinds for TSMC. The foundry leader has an illustrious customer base, including Apple, AMD, and Nvidia, that looks to apply cutting-edge process technologies to its semiconductor designs. TSMC employs more than 73,000 people.
Taiwan Semiconductor: A Financial Overview
Market Capitalization Analysis: The company's market capitalization is above the industry average, indicating that it is relatively larger in size compared to peers. This may suggest a higher level of investor confidence and market recognition.
Revenue Growth: Taiwan Semiconductor displayed positive results in 3 months. As of 31 December, 2024, the company achieved a solid revenue growth rate of approximately 38.84%. This indicates a notable increase in the company's top-line earnings. When compared to others in the Information Technology sector, the company excelled with a growth rate higher than the average among peers.
Net Margin: Taiwan Semiconductor's net margin surpasses industry standards, highlighting the company's exceptional financial performance. With an impressive 43.14% net margin, the company effectively manages costs and achieves strong profitability.
Return on Equity (ROE): The company's ROE is a standout performer, exceeding industry averages. With an impressive ROE of 9.05%, the company showcases effective utilization of equity capital.
Return on Assets (ROA): Taiwan Semiconductor's ROA stands out, surpassing industry averages. With an impressive ROA of 5.83%, the company demonstrates effective utilization of assets and strong financial performance.
Debt Management: Taiwan Semiconductor's debt-to-equity ratio is below the industry average. With a ratio of 0.24, the company relies less on debt financing, maintaining a healthier balance between debt and equity, which can be viewed positively by investors.
To track all earnings releases for Taiwan Semiconductor visit their earnings calendar on our site.
This article was generated by Benzinga's automated content engine and reviewed by an editor.
Latest Ratings for TSM
| Date | Firm | Action | From | To |
|---|---|---|---|---|
| Feb 2025 | Needham | Reiterates | Buy | Buy |
| Jan 2025 | Barclays | Maintains | Overweight | Overweight |
| Jan 2025 | Needham | Reiterates | Buy | Buy |
View More Analyst Ratings for TSM
View the Latest Analyst Ratings
© 2025 Benzinga.com. Benzinga does not provide investment advice. All rights reserved.
The views and opinions expressed herein are the views and opinions of the author and do not necessarily reflect those of Nasdaq, Inc.

