
Bitcoin‘s price action has been a rollercoaster ride in 2024, rising by over 50% to reach around $64,350 on June 23. However, this period of market growth has witnessed upside exhaustion near the elusive $70,000 mark. Since March, bulls have failed to clearly break out above the said resistance level, resulting in 20-25% price retreats on different occassions.
However, Bitcoin’s popular on-chain metric, dubbed the Adjusted Spent Output Profit Ratio (aSOPR), indicates that the cryptocurrency might be gearing up for a significant breakout in the coming weeks. Let’s discuss it in detail.
Bitcoin’s aSOPR Metric Hints At New Record High Formations
For the unversed: aSOPR measures the profit ratio of spent outputs on the Bitcoin network. That said, when the aSOPR reading goes above 1, it means that traders are selling their holdings at a profit. Conversely, a value below 1 suggests that coins are being sold at a loss.
The chart below measures the aSOPR reading on a 200-day Simple Moving Average (SMA; the yellow wave) to provide a smoother, long-term view of these profit-taking activities.
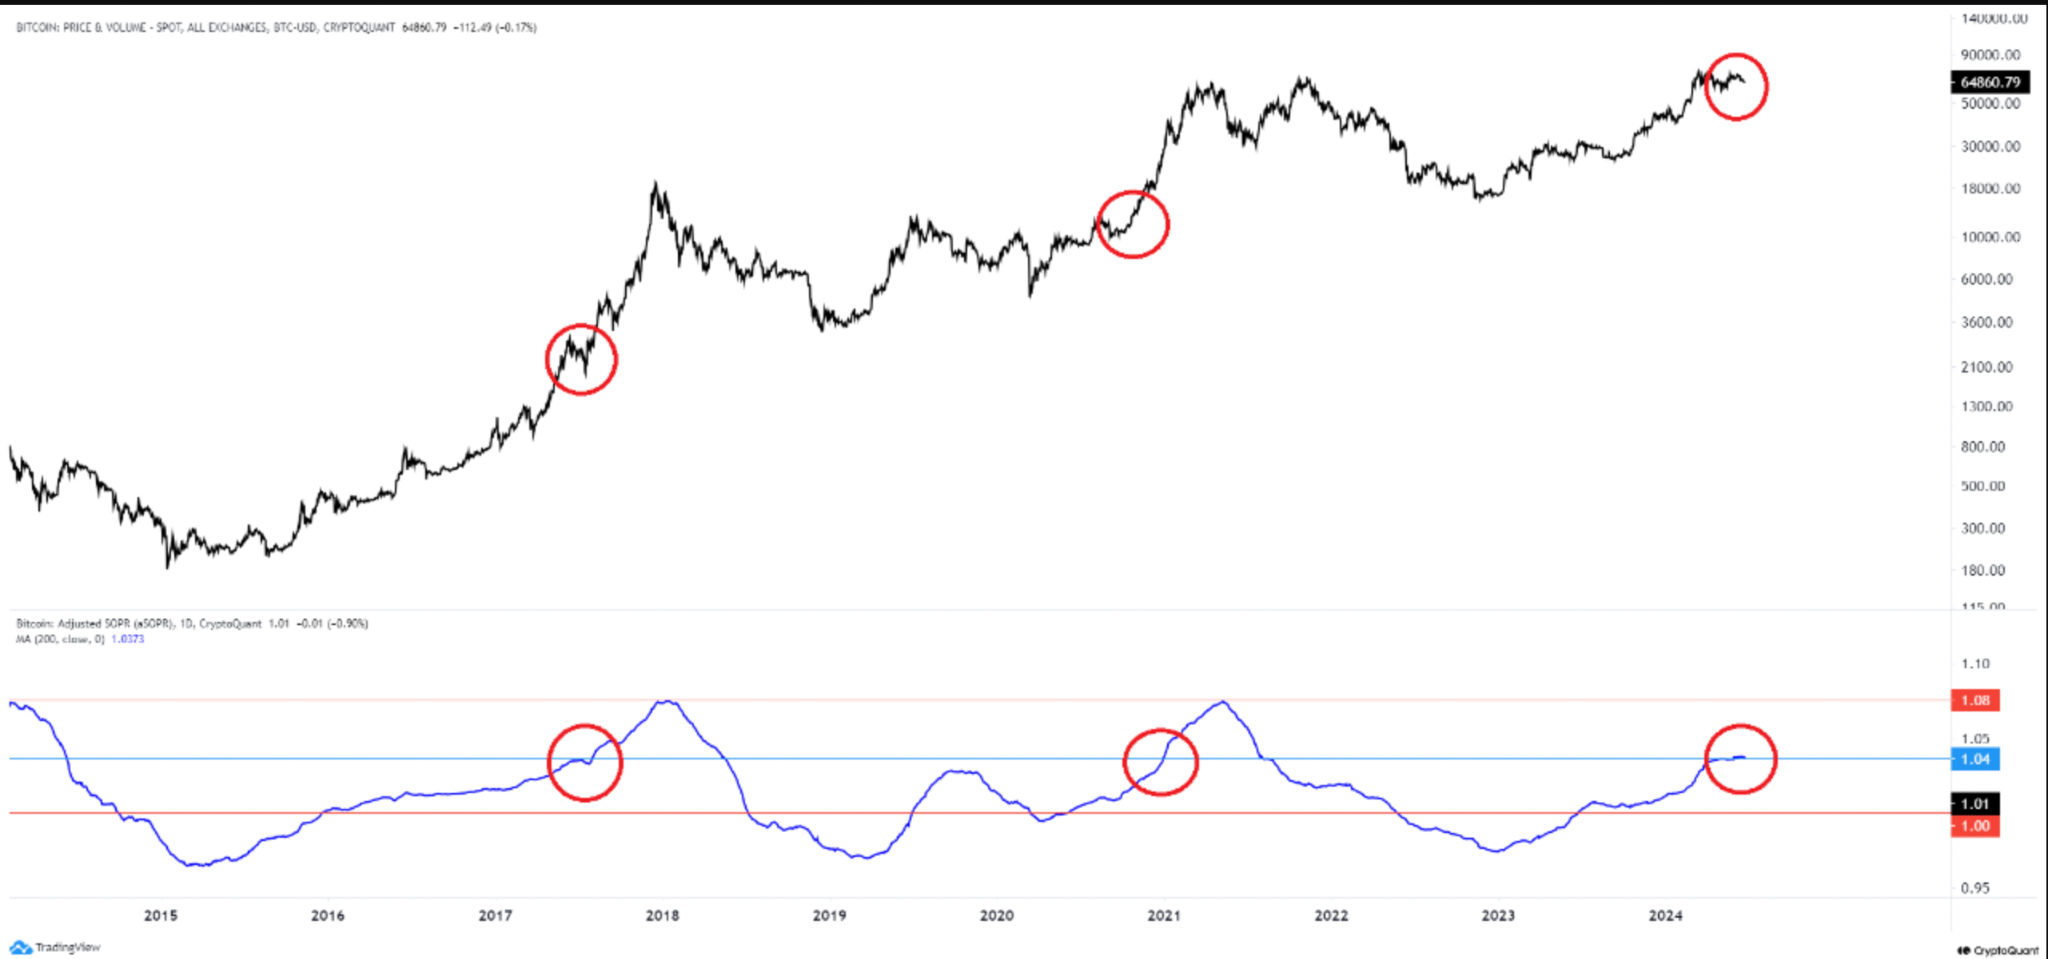 Bitcoin price vs. aSOPR performance chart. Source: CryptoQuant
Historical data reveals that when the aSOPR approaches 1.08, Bitcoin prices often experience a correction phase. As of June 23, the Bitcoin aSOPR was around 1.03, suggesting that the cryptocurrency’s price could continue to rise unless its aSOPR reaches 1.08.
A similar upside bias is observable in Bitcoin’s MVRV metric, which is the ratio on BTC’s market cap and realized cap, indicating whether the price is overvalued or not. Historically, an MVRV reading calculated on a 200-day simple moving average over ‘3’ has indicated price top and a reading below ‘1’ has indicated price bottom.
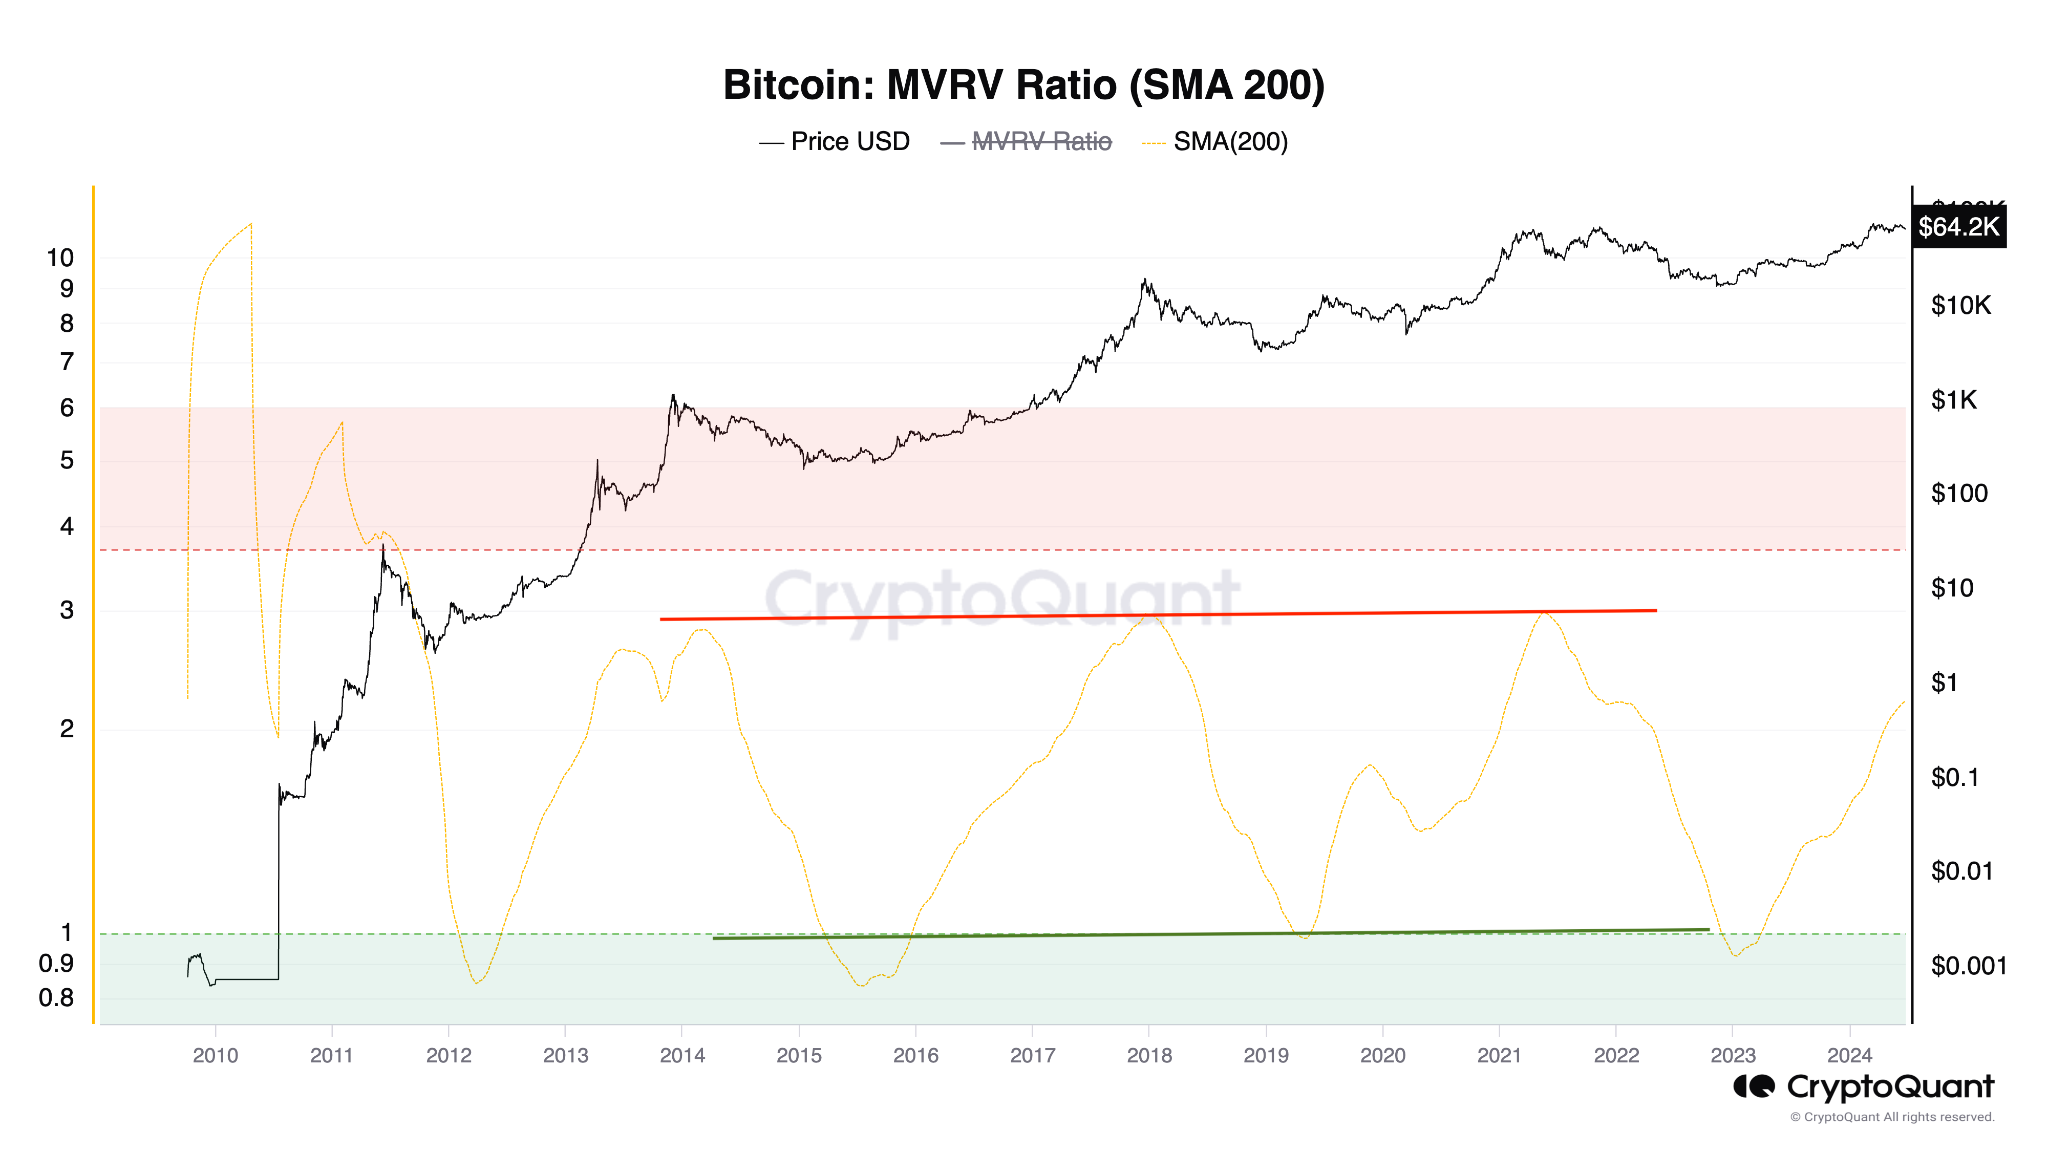 Bitcoin MVRV ratio (200-day SMA) chart. Source: CryptoQuant
As of June 23, the Bitcoin MVRV reading was around 2.20, indicating there’s more room for the price to grow until the ratio nears 3.00.
Where Will Bitcoin Price Go Next?
From a technical standpoint, Bitcoin has entered a consolidation phase following its run-up to its record high at around $74,000 in March. Consolidations after strong rallies typically setup bullish continuation patterns, which appears to be the case with Bitcoin, as well.
Notably, Bitcoin’s consolidation channel looks like a bull flag pattern, characterized by the price fluctuating inside a range defined by two parallel trendlines. Bull flags typically resolve when the price breaks above the upper trendline and rises to a level at length equal to height of the uptrend that preceded the bull flag formation.
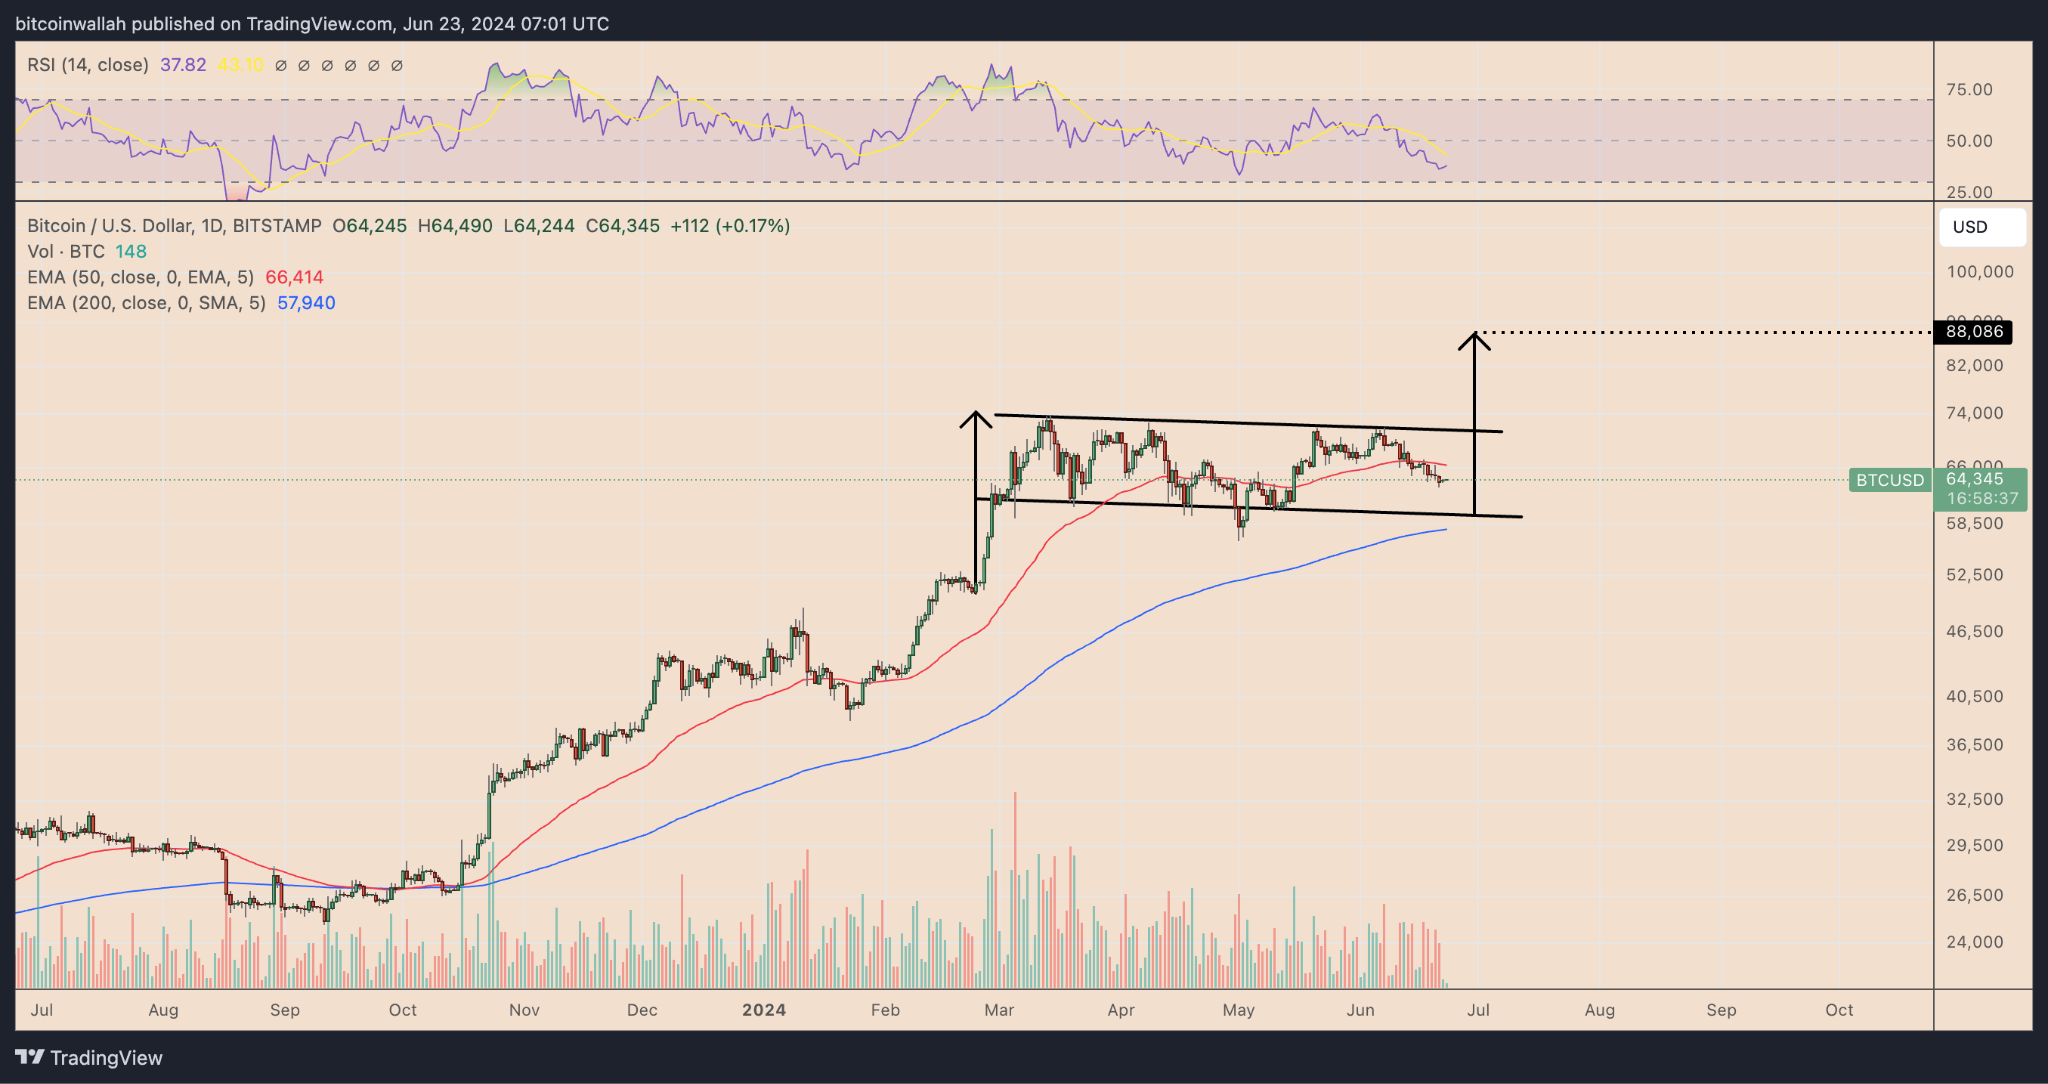 BTC/USD daily price chart. Source: TradingView
As a result of this technical rule, BTC’s price is eyeing a run-up toward $88,000 by August, an uptrend receiving support from the aSOPR and MVRV Ratio metrics discussed above. Meanwhile, Bitcoin’s daily relative strength index is treading around its oversold threshold of 30, which further boosts its possibility of continuing its bull run in the coming months.
This article was originally posted on FX Empire
More From FXEMPIRE:
- Hermetic Labs Launches Blockchain Consulting Services
- Bitcoin Price Forecast – Bitcoin Plunges to Kick Off The Week
- Nasdaq, Dow Jones, S&P 500 News: Futures Inch Higher; Nvidia’s Decline Sparks Caution
The views and opinions expressed herein are the views and opinions of the author and do not necessarily reflect those of Nasdaq, Inc.

