The U.S. stock indices fell sharply over the past month, but investors are keeping their fingers crossed that October will be different because there are indications that the S&P 500 may be close to forming a bottom, which could happen as soon as this week.
Background
In September, the U.S. stock market dropped: The S&P 500 index ended the month down 4.9% and was down 3.7% for the quarter, but it is up over 12% for the year. The Nasdaq-100 index fell more than 5.8 percentage points in September and 4.1 percentage points for the quarter, but up a whopping 28% for the year. The Dow Jones Industrial Average decreased 3.5% during September, down 2.6% for the quarter and only 0.90% up year-to-date.
While many factors have contributed to September's declines in major U.S. stock indexes, one in particular has caused investors to become wary: Traders are worried that the U.S. economy is slowing down because of the high interest rate environment, but still feel that the U.S. economy will experience a soft landing, not a hard landing, because of the persistent risk of higher inflation. There is widespread belief among investors that the Federal Reserve will continue hiking interest rates, with many betting that the central bank will raise rates by 25 basis points at its next meeting in November. A sell-off in the U.S. stock market has resulted from traders being much more anxious as a result of all these variables.
Although fundamentally things still look tricky, leading the Fed to maintain a more hawkish monetary policy tone than many would like, the upcoming U.S. nonfarm payroll data, due on Friday, would be a big deal for the Fed in determining the direction of their monetary policy. However, things have improved greatly on the technical front.
First, the S&P 500 daily time frame is getting close to a significant uptrend line, which has been tested many times, and the price has had a solid bounce following the testing of that level (see chart below). The 200-day Simple Moving Average, which functions as support, is a level that the S&P 500 index is getting close to.

Chart from Exness
Things become much more intriguing when we expand our focus from the daily time period to the weekly time frame for the S&P 500. This week marks the fourth in a row of declines for the index, indicating that the present trend has been going on for quite some time. The price is also quite close to the 50-week simple moving average (SMA), which may provide further support.
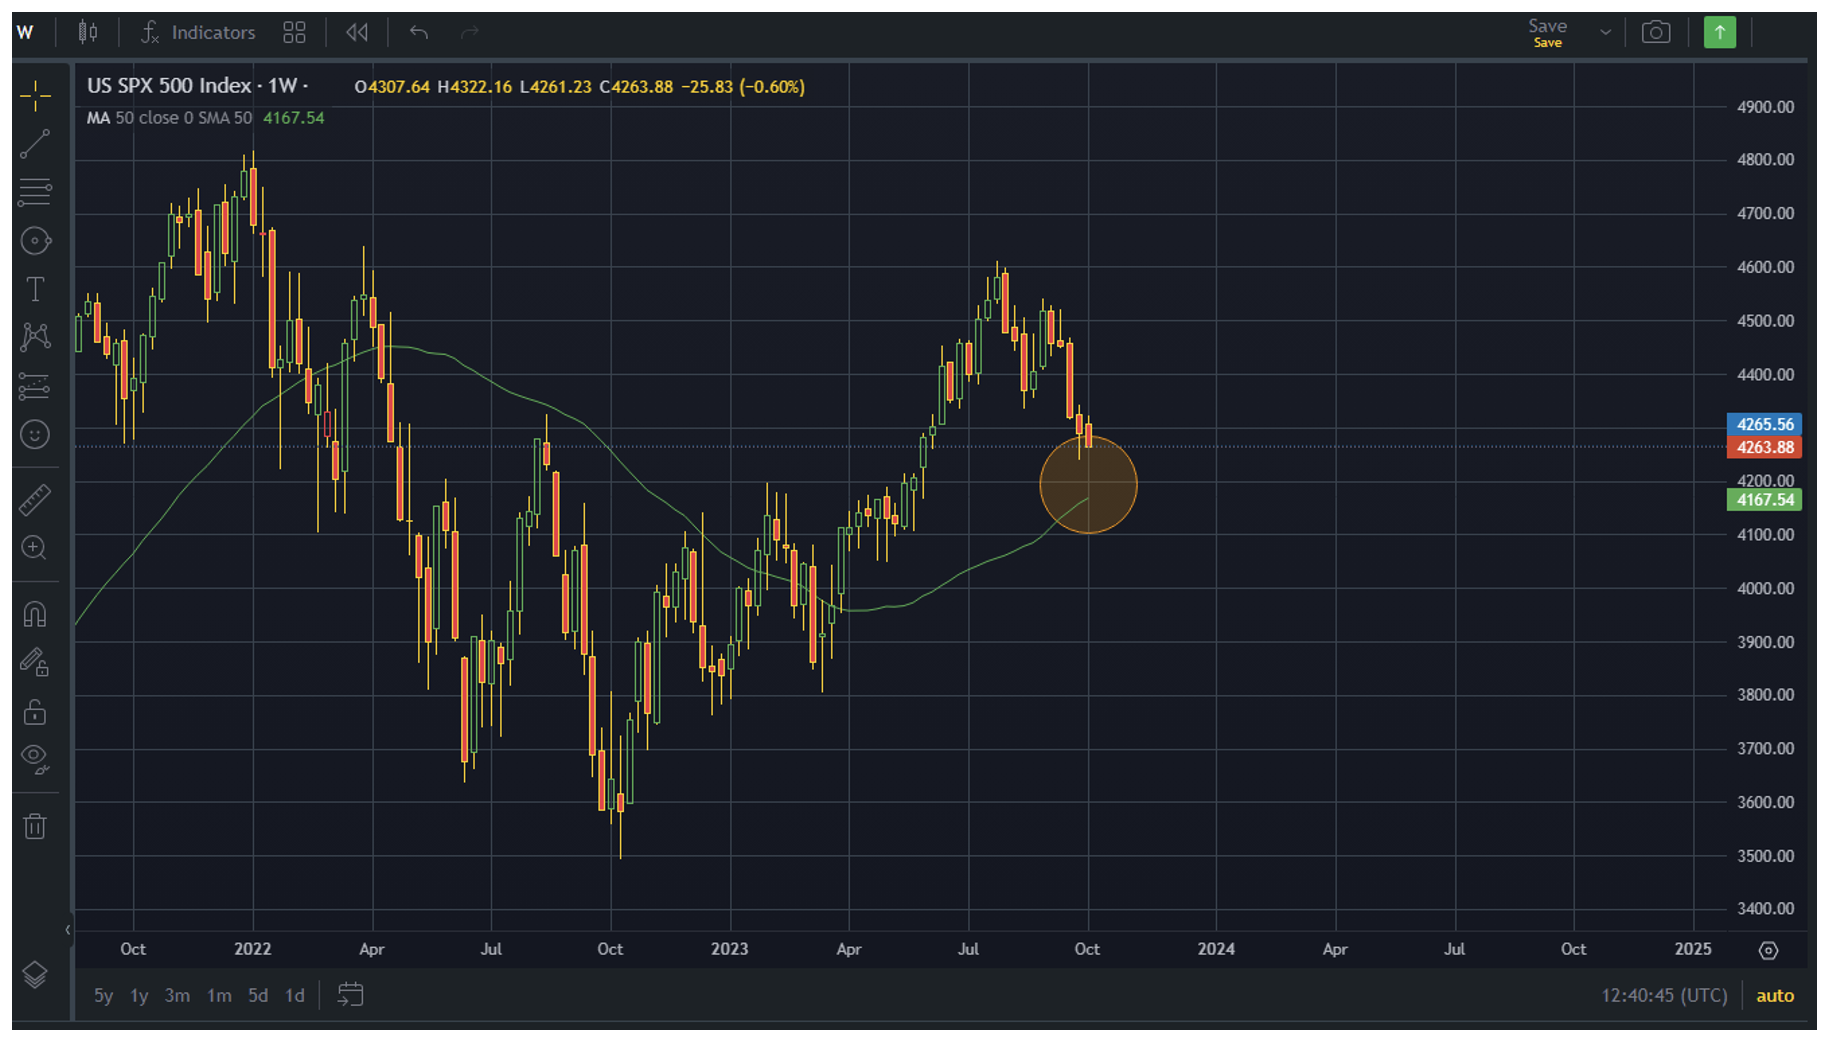
The U.S. stock indices have seen stellar performance so far this year, apart from the Dow Jones Industrial Average; the correction in September was a healthy one. The S&P 500 is getting close to key levels that could signal its next move.
The views and opinions expressed herein are the views and opinions of the author and do not necessarily reflect those of Nasdaq, Inc.

Naeem Aslam
I am a former Hedge Fund Trader with over 15 years of experience in investment banking. During my early career, I was awarded a national award (Young Irish Broker) in 2010. Over the years, I have worked with Bank of America in equity trading and with Bank of New York in hedge fund trading. I specialize in Blockchain technologies (cryptocurrencies and digital assets) and Sustainable Investments. In my career thus far, I have also extensively covered Equities, Commodities and Forex.
Read Naeem's Bio