
David Iben put it well when he said, 'Volatility is not a risk we care about. What we care about is avoiding the permanent loss of capital.' When we think about how risky a company is, we always like to look at its use of debt, since debt overload can lead to ruin. We can see that Kennametal Inc. (NYSE:KMT) does use debt in its business. But the more important question is: how much risk is that debt creating?
When Is Debt Dangerous?
Debt assists a business until the business has trouble paying it off, either with new capital or with free cash flow. If things get really bad, the lenders can take control of the business. However, a more usual (but still expensive) situation is where a company must dilute shareholders at a cheap share price simply to get debt under control. Having said that, the most common situation is where a company manages its debt reasonably well - and to its own advantage. When we think about a company's use of debt, we first look at cash and debt together.
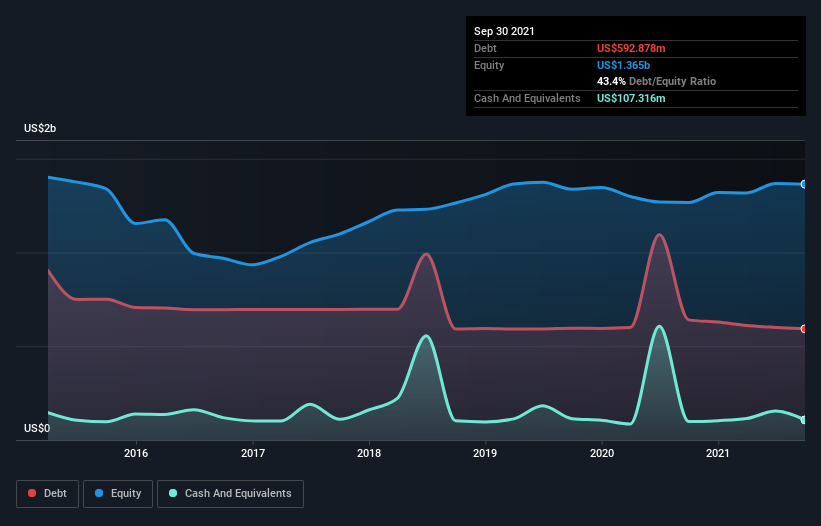
What Is Kennametal's Net Debt?
As you can see below, Kennametal had US$592.9m of debt at September 2021, down from US$640.6m a year prior. However, it also had US$107.3m in cash, and so its net debt is US$485.6m.
How Strong Is Kennametal's Balance Sheet?
We can see from the most recent balance sheet that Kennametal had liabilities of US$389.2m falling due within a year, and liabilities of US$853.7m due beyond that. On the other hand, it had cash of US$107.3m and US$279.7m worth of receivables due within a year. So it has liabilities totalling US$855.9m more than its cash and near-term receivables, combined.
While this might seem like a lot, it is not so bad since Kennametal has a market capitalization of US$2.94b, and so it could probably strengthen its balance sheet by raising capital if it needed to. However, it is still worthwhile taking a close look at its ability to pay off debt.
We use two main ratios to inform us about debt levels relative to earnings. The first is net debt divided by earnings before interest, tax, depreciation, and amortization (EBITDA), while the second is how many times its earnings before interest and tax (EBIT) covers its interest expense (or its interest cover, for short). The advantage of this approach is that we take into account both the absolute quantum of debt (with net debt to EBITDA) and the actual interest expenses associated with that debt (with its interest cover ratio).
While Kennametal's low debt to EBITDA ratio of 1.5 suggests only modest use of debt, the fact that EBIT only covered the interest expense by 4.8 times last year does give us pause. So we'd recommend keeping a close eye on the impact financing costs are having on the business. It is well worth noting that Kennametal's EBIT shot up like bamboo after rain, gaining 39% in the last twelve months. That'll make it easier to manage its debt. The balance sheet is clearly the area to focus on when you are analysing debt. But ultimately the future profitability of the business will decide if Kennametal can strengthen its balance sheet over time. So if you're focused on the future you can check out this free report showing analyst profit forecasts.
Finally, while the tax-man may adore accounting profits, lenders only accept cold hard cash. So we clearly need to look at whether that EBIT is leading to corresponding free cash flow. In the last three years, Kennametal's free cash flow amounted to 32% of its EBIT, less than we'd expect. That's not great, when it comes to paying down debt.
Our View
When it comes to the balance sheet, the standout positive for Kennametal was the fact that it seems able to grow its EBIT confidently. However, our other observations weren't so heartening. For instance it seems like it has to struggle a bit to convert EBIT to free cash flow. When we consider all the elements mentioned above, it seems to us that Kennametal is managing its debt quite well. Having said that, the load is sufficiently heavy that we would recommend any shareholders keep a close eye on it. Above most other metrics, we think its important to track how fast earnings per share is growing, if at all. If you've also come to that realization, you're in luck, because today you can view this interactive graph of Kennametal's earnings per share history for free.
When all is said and done, sometimes its easier to focus on companies that don't even need debt. Readers can access a list of growth stocks with zero net debt 100% free, right now.
Have feedback on this article? Concerned about the content? Get in touch with us directly. Alternatively, email editorial-team (at) simplywallst.com.
This article by Simply Wall St is general in nature. We provide commentary based on historical data and analyst forecasts only using an unbiased methodology and our articles are not intended to be financial advice. It does not constitute a recommendation to buy or sell any stock, and does not take account of your objectives, or your financial situation. We aim to bring you long-term focused analysis driven by fundamental data. Note that our analysis may not factor in the latest price-sensitive company announcements or qualitative material. Simply Wall St has no position in any stocks mentioned.
The views and opinions expressed herein are the views and opinions of the author and do not necessarily reflect those of Nasdaq, Inc.

