
Mark Marex, CFA, Senior Director, Head of Index Research, Americas
Perhaps the single biggest question on the minds of US equity investors today is to what extent the AI trade resembles previous market bubble episodes, with the late ‘90s Internet/Telecom bubble the closest analogue. The Nasdaq-100 Index® (NDX®) is now, as it was then, something of an epicenter for the debate, given it is home to a majority of the most valuable, innovative, and important players in the emergence and adoption of AI technology. While a number of meaningful uncertainties remain around AI (e.g., how much better/cheaper can the technology get; how much more capex will be needed to get there; what is the universe of monetization opportunities available to the various layers of the AI infrastructure stack), there are also several unique dynamics we can identify that warrant caution in analogizing too much to the late ‘90s – at least with respect to making predictions for the Nasdaq-100. Some of these have to do with the nature of AI technology itself, while others relate to the considerable differences in the composition of the Nasdaq-100 today vs. 25 years ago, particularly in terms of: fundamental strength, valuations, leverage, company size, and interaction with the disruptive technology of the time.
’99 Problems? Profitability Ain’t One
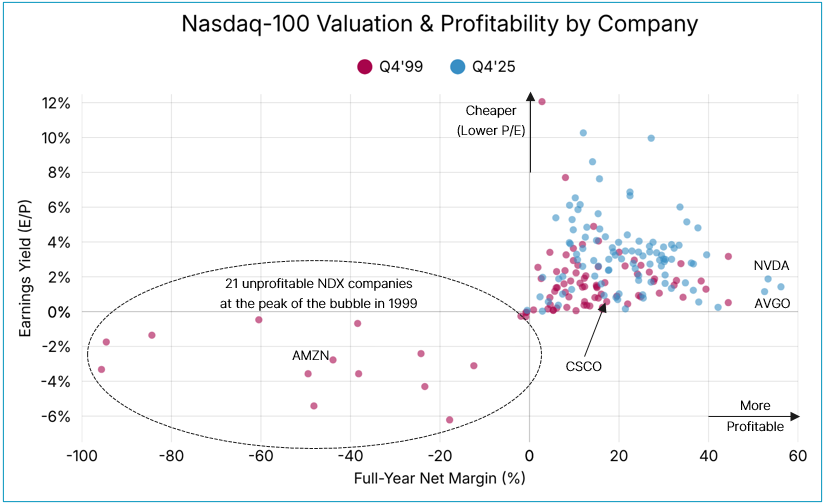
Source: Nasdaq Global Indexes, Factset as of 11/14/25. Q4’99 data reflects index composition and P/E ratios as of 12/31/99, with net profit margins shown for full-year 1999. Q4’25 data reflects index composition and P/E ratios as of 11/14/25, with net profit margins calculated as full-year 2025 consensus Net Income divided by Sales. P/E ratios displayed as earnings yields (E/P) for visualization purposes. Not shown: MSTR (2025 forecasted net margin >2,000%); CHTR (2025 E/P = 18%); CMCSA (2025 E/P = 22%); PCAR (1999 E/P = 17%); NWA (1999 E/P = 16%). 4Q’99 data unavailable for Legato Systems & Smurfit-Stone Container.
As can be seen in the first chart above, the distribution of companies by valuation and profitability is starkly different today vs. 25 years, when roughly one-fifth of the index by constituent count (21 companies) generated negative net margins over the course of 1999, the peak of the bubble (including high-flying market leaders like Amazon (AMZN)). Of the companies that were profitable back then, net margins tended to be substantially lower than today (22.8 vs. 42.2), while valuation ratios were much higher (i.e., earnings yields – which are the inverse of P/E ratios – are much more closely clustered around 0%.)
Visualizing these relationships by constructing profitability buckets and summing up the market capitalization of the index constituents, this dynamic appears even starker. Today, 99.9% of index exposure is profitable, with 50% of exposure generating very healthy net margins in the range of 25-50%, and an additional 20.4% of the index generating margins between 50-100% (led by two of the biggest names today, Nvidia (NVDA) and Broadcom (AVGO)). These two semiconductor names are at the very heart of the AI infrastructure/capex spending spree with margins just north of 50% in 2025, while their closest equivalent in the late ‘90s – Cisco (CSCO) – generated relatively tame margins of 17.25% in 1999. But the story is broader than just a few of the biggest names: remarkably, in 1999, not a single index constituent generated margins in the range of 50-100%; two outliers did however record net margins north of 100%. More importantly, 21.1% of the index had thin margins of 0-10%, while 10.5% saw negative margins.

Source: Nasdaq Global Indexes, Factset as of 11/14/25.
’99 Problems? Valuation Ain’t One
Market analysts have generally been careful to point out that the current AI wave does not match up with the late ‘90s in terms of valuations, but it is worth pointing out just how much more extreme P/E ratios were back then. Per Factset’s earliest available data at the index level, NDX sported a trailing P/E ratio of 113 on December 29, 2000 – after a drawdown of 50% had already taken place from peak index levels on March 27, 2000. On an imputed basis based on aggregate index earnings and market caps, the index P/E was 104 as of December 31, 1999. Thus it is safe to say that index P/Es were above 100 for at least a year and likely got as high as 150-200 at the very peak of the bubble in 1Q’00, right as forward earnings began a multiyear collapse. By comparison, NDX trailing P/Es have been largely in a range within the low 30s over the past year.
This valuation gap is especially prominent among the index’s biggest constituents at year-end 1999, half of which attained trailing P/E ratios above 100, with Yahoo (YHOO) reaching around 2,000! By contrast, today’s top 10 largest NDX constituents all have P/E ratios below 100 except Tesla (TSLA) at ~270, with Broadcom (AVGO) the only other one meaningfully above 50.

Source: Nasdaq Global Indexes, Factset as of 11/14/25. YHOO (Yahoo!)’s P/E at EOY’99 estimated to be around 2,000.
Segmenting index company market caps again, this time by P/E bucket, illustrates another particularly noteworthy contrast. At the very peak of the ‘90s bubble, nearly three-fourths of the Nasdaq-100 traded either at a P/E north of 60 or was unprofitable. Today, the stats are almost a mirror image, as more than three-fourths of the index trades below 60, with the biggest segment by far being the bucket of companies with P/Es between 20-40, at 59.1% of aggregate index market cap.

Source: Nasdaq Global Indexes, Factset as of 11/14/25.
’99 Problems? Extreme Performance Ain’t One
Nearly three years to the date after the launch of ChatGPT kicked off the current AI wave, the Nasdaq-100 has generated remarkably similar performance to the same period of time that followed Netscape’s IPO on August 9, 1995 – which is a common marker for the beginning of the Dotcom bubble period. The index has gained 115% following ChatGPT’s launch (thru October 31, 2025) vs. 132% post-Netscape IPO (thru July 2, 1998) – at first glance, tracking roughly in-line. Yet, the more consequential takeaway from examining NDX’s late ‘90s performance is in the roughly 21-month period that followed up until the peak in March 2000, when another incremental gain of 253% brought the entire post-Netscape surge to a stunning 718%. Said another way, the late ‘90s bubble resulted in NDX performance that was more than six times greater than what has been observed in the current AI wave.

The performance discrepancy is even more glaring when taking into account the fact that NDX was coming out of a serious bear market when ChatGPT was launched, sitting on a YTD drawdown of ~30%. When Netscape IPO’d in August 1995, the index had already run up by 42% YTD.
Bottom Line: This Time Seems (at Least Somewhat) Different
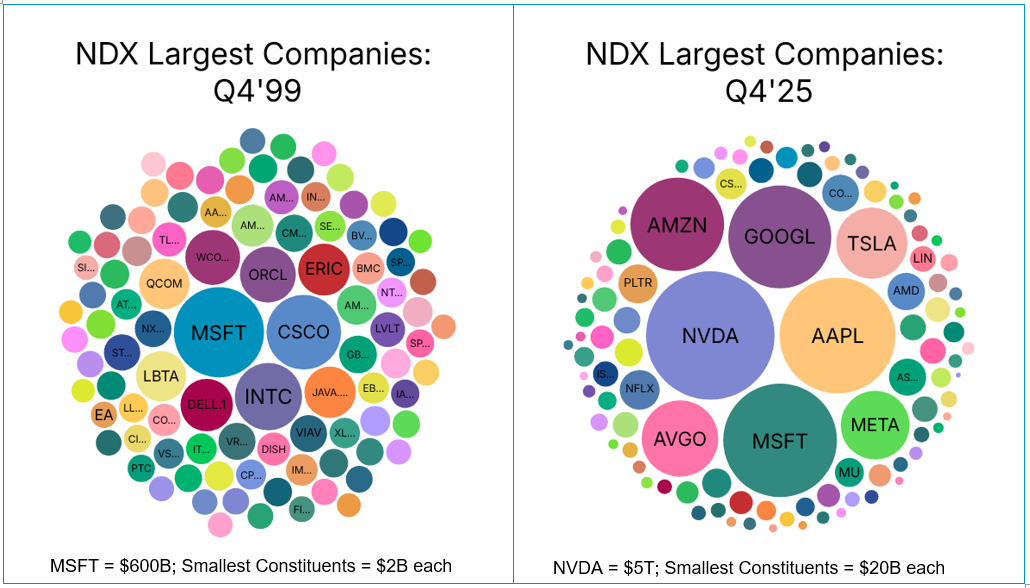
From a fundamental perspective, both company-level and index-level metrics prove that today’s Nasdaq-100 bears little resemblance to the Nasdaq-100 of the late ‘90s. While a few of the Dotcom bubble’s biggest players are still in the index today – notably Microsoft, Cisco, Intel, and Qualcomm – only Microsoft still ranks among the top 10 largest holdings (and has transformed its business model substantially in the meantime). Along with a number of other fundamentally strong, well-diversified companies that now make up the index’s megacap core (Alphabet/Google, Apple, Amazon, Meta Platforms), there’s also Nvidia and Broadcom – the two biggest players in sourcing the physical infrastructure of the time (GPUs and ASICs), akin to Cisco back then – both of whom are seeing valuations kept much more in check than their infamous predecessor, while generating profit margins that are around three times fatter to boot. And while Tesla has always been something of an outlier in this era in terms of valuation, it is least exposed to the AI trade in terms of direct revenue earned and capex investment undertaken, with a history of behaving according to its own unique mix of market, investor, and thematic dynamics. Looked at together as a group, these eight largest NDX names (Mag 7 + Broadcom) account for around 50% of index exposure today, and comprise a much more solid fundamental core than their equivalents in the late ‘90s: $630B in 2025 Net Income, average Net Margin of 31%, and average Market Cap of ~$3T. In contrast, the largest 10 names as of 4Q’99 generated only $27B in Net Income for the year ($52B in 2025 dollars), had an average Net Margin of 14.6%, and an average Market Cap of $200B. These fundamental differences across the largest names – combined with generally much more profitable smaller constituents – explain why today’s index trades at a trailing P/E ratio discount of around two-thirds to three-fourths (low 30s vs. low 100s) against its late ‘90s iteration.
Source: Nasdaq Global Indexes, Factset as of 11/14/25.
Beyond the rather straightforward comparisons of profitability, valuation, and performance, there are notable qualitative differences in how the AI technological wave has progressed compared to the Internet/Telecom co-bubbles:
- Excess capacity not an issue: Networking infrastructure was built out at a frenzied pace in the late 1990s for one overarching reason, namely that Internet traffic would increase at an inflated exponential growth rate (doubling every ~3 months) that was never fully achieved (in reality, closer to doubling every ~12 months)1. This backfired on most of the companies undertaking this risk/investment – including a number of the largest and most notorious bankruptcies in history (e.g. Global Crossing, among 23 telecom bankruptcies in total)2– leading to unused network capacity reaching as high as 95 to 97% at the end of the fiber/broadband capex cycle. This is simply not the case in the current AI cycle where, three years in and with tremendous capacity already added, every quarter the backlogs are building at the major cloud providers (up to $750B across AMZN/MSFT/GOOG, as of 3Q’25), and they cannot seem to add capacity fast enough to meet the demand for AI compute3
- Direct ROI accruing to companies building out infrastructure: The four biggest AI capex spenders seem to be deriving some of the most compelling ROI from the technology itself, whereas the telecoms of the late ‘90s were simply building out capex in order to sell capacity to others
- AMZN mentioned this quarter that they have already observed incremental $10B sales growth from their new AI-powered shopping assistant; last quarter cited 10% reduction in robot travel time across their warehouses using a custom AI model to optimize that flow
- MSFT has already sold 150MM+ subscribers on one or more of its Copilot / Agent offerings, and retains highest share among coding assistants with its Github Copilot
- GOOG has cited a massive increase in the monetization rate of its Ads business thanks to AI, not to mention an acceleration in core Search revenues, Youtube, traction w/ Waymo self-driving, etc., all of which has helped double their quartelry revenue from $50B to $100B in just five years
- META continues to drive more engagement in their Family of Apps which they are citing as at least partially due to the success of AI integration
- Fraud and hidden leverage were rampant in the ‘90s, even among some of the biggest players in the telecom bubble like MCI Worldcom, which convinced investors that much of the capex spending was justified by illusory fundamental growth. Post-Sarbanes-Oxley, there is a much lesser risk of today’s capex spenders misleading investors on any kind of similar scale, if at all
- Far less debt vs. free cash flow to fund capex: true among all four major Nasdaq-listed AI capex spenders compared to the major telecoms in late ‘90s. It remains to be seen how much the big four (MSFT/GOOG/AMZN/META) lever up, although even with recent debt financing deals grabbing headlines, MSFT has a Cash/Total Debt ratio of ~2.3:1, GOOG at ~4:1, AMZN at 2:1; and META at ~1.5:1; in other words, the big four have negative Net Debt positions, to say nothing of de minimus Long-Term Debt-to-Market Cap ratios of 0.9%/0.7%/1.5%/2.1%, respectively:

The current AI wave does bear a few similarities with the Internet/DotCom bubble, starting with similarly grandiose proclamations and hopes for its potential to transform the economy in a profound, disruptive manner. A level of skepticism around some of the circular financing and investment deals announced in recent months, led by OpenAI and Nvidia, seems warranted; given the extended time horizons for many of those agreements, however, a wide range of outcomes needs to be considered. There are growing doubts around maintaining sufficient returns on invested capital, given the reliance on lofty projections for AI revenue continuing to grow at an exponential rate over the next decade. But to the extent there are concerns around company valuations and profitability (privately-owned OpenAI/Anthropic, dozens of other AI startups), leverage (NYSE-listed Oracle, with about eight times more debt on its balance sheet vs. cash), or unwarranted price appreciation, they tend to exist mostly outside of the Nasdaq-100.
The Nasdaq-100 Index looks substantially different today than it did in the late ‘90s, when it was weighed down by a combination of heavily indebted (and fraudulent, in some cases) fiber/broadband capex spenders – across the Telecoms sector as well as networking equipment makers – and dozens of recently-IPO’d Internet companies with stratospheric valuations supported by minimal or nonexistent earnings. With its current solid core of fundamentally strong megacaps who are leading the AI capex spending spree, complemented by a long tail of overwhelmingly profitable (99/100 constituents with positive 2025 Net Income) and cashflow-generating (95/100 constituents with positive 2025 Free Cash Flow) large caps in Technology and other sectors, the Nasdaq-100 seems well positioned to benefit from this latest technological advancement in a way that may echo, but not necessarily repeat, prior episodes in its 40-year history.
Sources: Nasdaq Global Indexes, Bloomberg, Factset, Goldman Sachs Research, Meta Platforms, Alphabet, Amazon, Microsoft.
Information set forth in this communication contains forward-looking statements that involve a number of risks and uncertainties. Nasdaq cautions readers that any forward-looking information is not a guarantee of future performance and that actual results could differ materially from those contained in the forward-looking information. Forward-looking statements can be identified by words such as “will,” “believe” and other words and terms of similar meaning. Forward-looking statements involve a number of risks, uncertainties or other factors beyond Nasdaq’s control. These risks and uncertainties are detailed in Nasdaq’s filings with the U.S. Securities and Exchange Commission, including its annual reports on Form 10-K and quarterly reports on Form 10-Q which are available on Nasdaq’s investor relations website at http://ir.nasdaq.com and the SEC’s website at www.sec.gov. Nasdaq undertakes no obligation to publicly update any forward-looking statement, whether as a result of new information, future events or otherwise.
Footnotes
1. https://www.fabricatedknowledge.com/p/lessons-from-history-the-rise-and
2. https://www.princeton.edu/~starr/articles/articles02/Starr-TelecomImplosion-9-02.htm
3. https://www.fierce-network.com/cloud/cloud-q3-snapshot-capex-train-gains-steam
Discalimer:
Nasdaq®, Nasdaq-100 Index®, Nasdaq-100®, and NDX® are registered trademarks of Nasdaq, Inc. The information contained above is provided for informational and educational purposes only, and nothing contained herein should be construed as investment advice, either on behalf of a particular security or an overall investment strategy. Neither Nasdaq, Inc. nor any of its affiliates makes any recommendation to buy or sell any security or any representation about the financial condition of any company. Statements regarding Nasdaq-listed companies or Nasdaq proprietary indexes are not guarantees of future performance. Actual results may differ materially from those expressed or implied. Past performance is not indicative of future results. Investors should undertake their own due diligence and carefully evaluate companies before investing. ADVICE FROM A SECURITIES PROFESSIONAL IS STRONGLY ADVISED.


Latest articles

This data feed is not available at this time.
Data is currently not available