
Nasdaq Monthly Index Performance Commentary – March 2026
- The Nasdaq-100 Index® (NDX®) ended March lower by -4.9%.
- The Iran war has dominated headlines with the fallout from geopolitical uncertainties and higher energy prices dictating financial market returns in March.
- Nasdaq’s suite of indexes ended March with 118 out of 128 indexes tracked in our report posting losses and the average index down 6.2%.
Chart of the Month
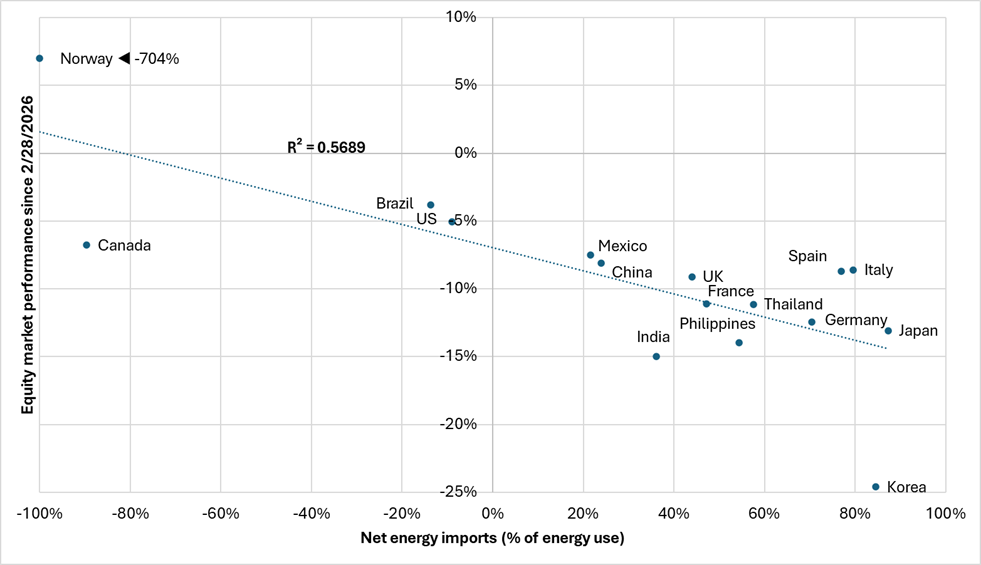
Source: World Bank, Bloomberg. Notes: performance based on Nasdaq country index returns. In USDs. As of March 31, 2026
Executive Summary
The Iran war has resulted in the largest oil supply disruption in history per the International Energy Association (IEA). The conflict is impacting 7.5% of global oil supply and the IEA estimates that the flow of crude oil and related products passing through the Strait of Hormuz are down by more than 90% versus a year ago. J.P. Morgan estimates that each $10 incremental move higher in oil prices can reduce GDP estimates by 0.15% to 0.20%, while a $10 increase in oil prices can push inflation up by 0.35%. Per our Chart of the Month, as the U.S. is a net energy exporter, the U.S. equity market has been one of the top relative performing Nasdaq country indexes since the onset of the war.
Given the rise in energy prices, U.S. 1 to 2 year inflation expectations have moved higher, mostly pricing out the probability of a rate cut through mid-2027 whereas as of March 10th, the market was pricing in a full 25bps cut in September 2026. Expectations of a more hawkish Fed amidst stagflation concerns have led to a stronger USD and a sell-off in emerging market equities (coupled with key emerging market economies being net energy importers-see the Chart of the Month)—though this follows a strong run for emerging markets over the past year. The prospects of higher U.S. rates and the stronger USD contributed to gold having its worst month (-11.6%) since October 2008.
The varying scenarios and outcomes of the conflict (e.g., duration of the war and effective closure of the Strait of Hormuz, what the off ramps look like for both sides, etc.) will impact the outlooks for global financial markets and economic forecasts. Amidst the geopolitical uncertainties and market volatility, focusing on the longer-term signal through the shorter-term noise remains paramount. Taking a step back, with all 100 companies in the Nasdaq-100 having reported Q4 2025 earnings, 75 companies representing 85% of the reported weight reported earnings that exceeded analyst earnings estimates. 84 companies representing 94% of the reported weight reported revenues that exceeded analyst estimates. As such, the underlying corporate fundamentals remain solid. But investors continue to monitor for the ensuing impacts from higher oil prices which could drive changes to economic and corporate earnings outlooks.
Nasdaq Indexes March 2026 Performance Recap
Among the 128 indexes tracked in this report, 10 finished March in positive territory, while 118 ended with negative returns. The best-performing index was the Credit Suisse Nasdaq WTI Crude Oil FLOWS106 TR™ Index (QUSOITR™), delivering a return of 15%. The worst performance was from the Nasdaq Sprott Silver Miners™ Index (NSLVR™) which declined 29.2% for the month. The average return across all 128 indexes for the month was -6.2%.
Nasdaq Featured Indexes
All fourteen Nasdaq Featured Indexes registered negative returns in March. The Nasdaq-100 Technology Sector™ Index (NDXT™) was the top performer, registering a return of -3.9% while the Nasdaq Innovators Completion Cap™ Index (NCX™) was the bottom performer in the group with a loss of 6.6%. Following a strong rally on the last day of the month, the Nasdaq-100 Index® (NDX®) posted a return of -4.9% on general market weakness related to the US-Iran conflict. Notably, larger cap names outperformed on a relative basis as the Nasdaq-100 Mega™ Index (NDXMEGA™) was down 4.3% and the Nasdaq-100 Equal Weighted™ Index (NDXE™) dropped 5.2%, Overall, this group of indexes was down by an average of 5%.
Nasdaq Global Indexes
Performance across the Nasdaq Global Indexes suite was weak as all nine indexes in the group had negative returns for March. The best performer in the group was the Nasdaq US Small Cap™ Index (NQUSS™) which lost 4.7% but benefited from the US market being a relative outperformer vs. international markets. With a stronger U.S. Dollar and a higher oil import dependency, international markets were hit particularly hard as the Nasdaq ASPA Ex-Japan™ Index (NQASPAXJP™) was the bottom performer with a return of -13.7%. The Nasdaq Developed Markets Ex United States™ Index (NQDMXUS™) and the Nasdaq Emerging Markets™ Index (NQEM™) were down 11.6% and 11.2%, respectively. Europe was down with the Nasdaq Europe™ Index (NQEU™) losing 10.3%. The Nasdaq Global™ Index (NQGI™) had a return of -7.8%. The average return for this group of indexes was -8.6%.
Nasdaq Sector-Specific Indexes
All six indexes within Nasdaq’s sector-specific indexes suite were negative. The bottom performer was the PHLX Gold/Silver™ Index (XAU™) which lost 20.4% in March. This followed a 23% rise February as gold and silver had rallied on a safe-haven bid given the rise in geopolitical tensions ahead of the attacks on Iran at the end of the month. The KBW Regional Banking™ Index (KRX™) was the top performer losing 2%. The average return for the group was -7.1%.
Nasdaq Thematic Indexes
Overall performance across the Nasdaq Thematic Tech lineup was generally negative with 22 out of the 26 indexes in the suite recording losses with an average loss of 5.5%. We saw something of a reversal from previous months as software companies including cloud and cybersecurity companies rallied as the threat of cyberattacks grew following the start of the war. The ISE Cyber Security UCITS™ Index (HUR™)was the best performer in the group rising 5.9%. The ISE Cyber Security™ Index (HXR™) also rose, gaining 4.1% while the Nasdaq ISE Cyber Security Select™ Index (HXRXL™) rose 2.6%. The BVP Nasdaq Emerging Cloud™ Index (EMCLOUD™) was up 0.2%. The worst performer was the Nasdaq International Patent Leaders™ Index (NQIPL™) which posted a loss of 15%. Semiconductor companies had drawdowns in-line with the broader market as the Nasdaq US Smart Semiconductor™ Index (NQSSSE™) lost 5.4% and the PHLX Semiconductor™ Index (SOX™) was down by 6.3%.
All sixteen indexes in the Nasdaq Thematic Renewables and Energy Transition Materials suite posted losses this month, with an average return of -5.5%. The U.S.-Iran conflict caused a sharp reversal from previous months as the closing of the Strait of Hormuz drove oil prices sharply higher, causing concerns for global growth. The Nasdaq Sprott Silver Miners™ Index (NSLVR™) was the worst performer in the group with a -29.2% return. Other industrial metals including nickel and copper as well as uranium saw price declines. The Nasdaq Sprott Nickel Miners™ Index (NSNIKL™)and the Nasdaq Sprott Junior Copper Miners™ Index (NSCOPJ™) had returns of -22.8% and -22% respectively while the Nasdaq Junior Uranium Miners™ Index (NSURNJ™) had a loss of 18.2%. The ISE Clean Edge Global Wind Energy™ Index (GWE™) was the top performer, losing 1.2%.
The Nasdaq Crypto suite rallied on the U.S.-Iran conflict, posting an average gain of 4.8% with all four indexes in positive territory. The Nasdaq Ether Settlement Price™ Index (NQETHS™) led the group with a gain of 8.9% while the lowest returning index was the Nasdaq Bitcoin Settlement Price™ Index (NQBTCS™) which was up 3.3%.
Nasdaq Quantitative Indexes
Across the index suites comprising Nasdaq’s quantitative offerings, 51 out of the 53 indexes posted losses in March, averaging a -4.8% return.
Eight out of the nine indexes in the Nasdaq Options & Other Quantitative suite saw losses with an average return of -2.6%. The Credit Suisse Nasdaq WTI Crude Oil FLOWS106 TR™ Index (QUSOITR™) was the only positive performer with a return of 15%. All thirteen Nasdaq Multifactor indexes were negative this month with an average return of -4.9%.
Within the Dorsey Wright momentum suite, the Dorsey Wright Energy Tech Leaders™ Index (DWEN™) was the best performer, up 10.6%. The Dorsey Wright Developed Markets Tech Leaders™ Index (DWADM™) was the worst performer, down 13%. Overall, fifteen of the sixteen indexes in the suite were negative with an average loss of 5.9%.
All fifteen indexes in the Nasdaq Dividend and Income suite posted losses this month, with an average return of -4.8%. The Nasdaq Select Canadian Dividend™ Index (NQCADIV™) topped the group with a loss of 1.4%. The worst performer in the group was the Nasdaq Emerging Markets High Equity Income™ Index (NQEMHEI™) which was down 8.6% for the month.
Disclaimer:
Nasdaq® is a registered trademark of Nasdaq, Inc. The information contained above is provided for informational and educational purposes only, and nothing contained herein should be construed as investment advice, either on behalf of a particular security or an overall investment strategy. Neither Nasdaq, Inc. nor any of its affiliates makes any recommendation to buy or sell any security or any representation about the financial condition of any company. Statements regarding Nasdaq-listed companies or Nasdaq proprietary indexes are not guarantees of future performance. Actual results may differ materially from those expressed or implied. Past performance is not indicative of future results. Investors should undertake their own due diligence and carefully evaluate companies before investing. ADVICE FROM A SECURITIES PROFESSIONAL IS STRONGLY ADVISED.
Information set forth in this release contains forward-looking statements that involve a number of risks and uncertainties. Nasdaq cautions readers that any forward-looking information is not a guarantee of future performance and that actual results could differ materially from those contained in the forward-looking information. Forward-looking statements can be identified by words such as “will,” “may”, and other words and terms of similar meaning. Such forward-looking statements include, but are not limited to, statements related to future activities and results. Forward-looking statements involve a number of risks, uncertainties or other factors beyond Nasdaq’s control. These risks and uncertainties are detailed in Nasdaq’s filings with the U.S. Securities and Exchange Commission, including its annual reports on Form 10-K and quarterly reports on Form 10-Q which are available on Nasdaq’s investor relations website at http://ir.nasdaq.com/ and the SEC’s website at www.sec.gov. Nasdaq undertakes no obligation to publicly update any forward-looking statement, whether as a result of new information, future events or otherwise.
© 2026. Nasdaq, Inc. All Rights Reserved.

Latest articles

This data feed is not available at this time.
Data is currently not available