
Key Points
- U.S. equity markets hit new highs early in December driven by expectations for business supportive fiscal policies and deregulation under President-elect Trump, a still resilient U.S. economy, and relatively loose financial conditions—fueling expectations for a broadening in corporate earnings growth. Later in the month, sentiment cooled amid worsening market breadth with mega cap tech names remaining as one of the few narrow areas of strength.
- Financial markets are likely still digesting the implications of a hawkish tilt by the Federal Reserve at its December 18th meeting given its expected path of inflation (higher) and future rate cuts (less). Despite continued optimism about US economic growth, the outlook internationally appears to have deteriorated further for a number of different reasons.
- Performance across Nasdaq’s suite of indexes finished mostly negative for December. Approximately three out of every four indexes tracked in our report experienced losses, with the average index down 4.0%.
Executive Summary
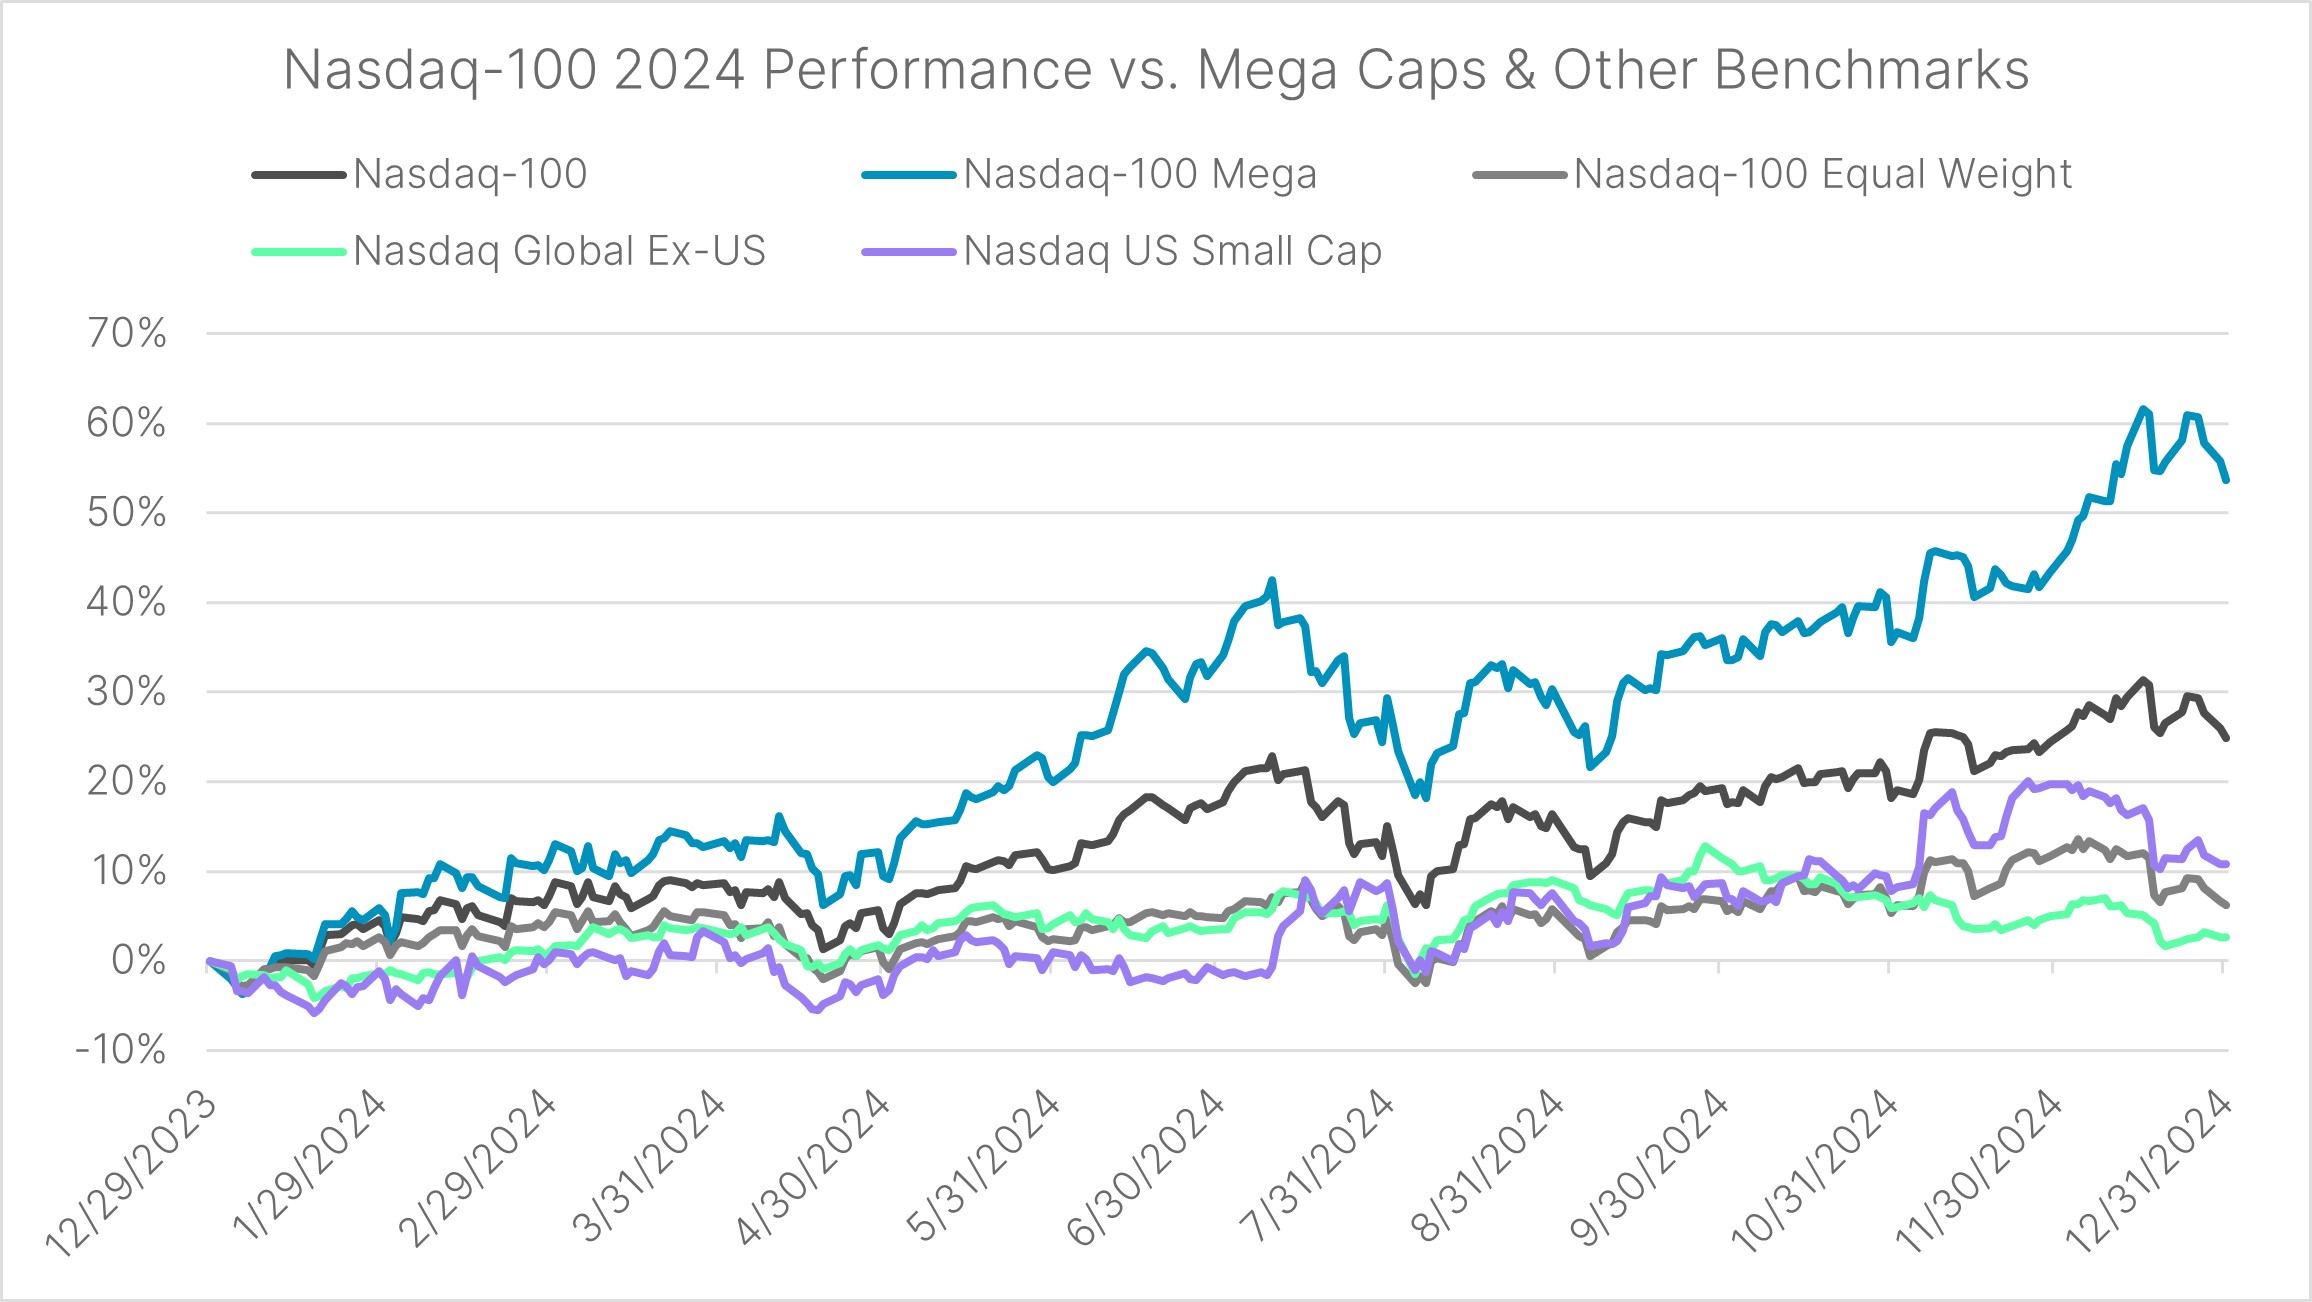
The Nasdaq-100® (NDX®) finished 2024 higher by 25% following a return of nearly 54% in 2023—its best two-year stretch since 1998 and 1999—and eclipsed 20,000 for the first time. While the fundamental strength of the mega cap technology cohort and AI revolution beneficiaries fueled the index gains as the Mag 7 accounted for 72% of NDX’s 2024 returns, estimates are for corporates earnings growth rates to broaden out in 2025. However, US small caps and international equities continued their string of underperformance.
Source: Nasdaq Global Indexes
Again, while the broader narrative is that index-weighted EPS will continue to grow into what have been elevated equity valuations (e.g., U.S. large caps have a forward P/E of ~26x), the markets are also digesting a notable shift from the Federal Reserve as it reduced the number of expected rate cuts in 2025 to two per the December meeting’s “dot plot” from four in September. Additionally, its outlook for the Fed funds rate rose to 3.1% by year-end 2026 (up from 2.9% at the September meeting) and it lifted its 2025 core inflation target (2.5% from 2.2%). While this end point for rate cuts is still lower versus market-based Fed funds pricing of around 3.7% by late 2026/early 2027, the equity markets reacted negatively given the Fed’s hawkish tone and outlook, which led to the worst day for the NDX in five months as it fell by 3.6% on December 18th. Concurrently, Treasury 10-year yields are back over 4.5%, had reached the highest level since May, and are now higher by almost 100bps from their mid-September lows—the Fed’s first rate cut of 50bps. Clearly, the implications of potential changes in fiscal policies (e.g. tariffs, tax cuts) and concerns around a stickier underlying inflationary backdrop – resulting in the Fed signaling a pause/slower trajectory of rate cuts – have driven Treasury yields higher. The seemingly “higher-for-longer” rates backdrop, in addition to the prospects of a broadening in corporate earnings growth to other equity sectors and areas, will factor into the potential shifts and/or broader participation of equity leadership in 2025.
Nasdaq Indexes December 2024 Performance Recap
Among the 135 indexes tracked in this report, 102 finished December in negative territory, while only 33 ended with positive returns. The best-performing index was Credit Suisse Nasdaq WTI Crude Oil FLOWS106 TR™ (QUSOITR™), delivering a return of 5.5%. The average return across all 135 indexes for the month was –4.0%.
Nasdaq Featured Indexes
Nine of the 13 Nasdaq Featured Indexes registered negative returns in December, a reversal from November when all 13 indexes finished higher. The Nasdaq-100 Mega™ (NDXMEGA™) recorded a surge of 7.2% while the Nasdaq-100 ex Top 30™ (NDX70™) fell by 6.7%, the lowest return of the entire group in December. Only 16 constituents of the Nasdaq-100® (NDX®) recorded gains this month. Overall, the group of indexes was down an average of 2.3%.
Nasdaq Global Indexes
All but one index in the Nasdaq Global Indexes suite recorded losses this month, averaging a return of -3.2%. The Nasdaq Emerging Markets™ (NQEM™) was the best performer, posting a return of just over 0.0%. The group's laggard was the Nasdaq US Small Cap™ (NQUSS™), which fell by 7.4%. The prospect of “higher-for-longer" looms large over the more interest rate-sensitive companies in the small cap space. Trump’s tariff increase proposals could also further elevate the cost of goods and fuel inflation, potentially further undermining the performance of US small-cap stocks.
Nasdaq Thematic Tech Indexes
Overall performance across the Nasdaq Thematic Tech lineup was mixed in December, averaging a monthly loss of 1.9%. The Nasdaq Global Future Mobility™ (NYGCAR™) was the top performer, registering gains of 2.3%. Meanwhile, the KBW Nasdaq Financial Technology™ (KFTX™) and the Nasdaq Biotechnology™ (NBI™) finished the month with the weakest returns of –7.8% and –7.2%, respectively. 15 constituents (30% in weights) in KFTX registered double-digit losses in December.
Nasdaq Thematic Renewables and Energy Transition Materials Indexes
All 13 indexes in the suite posted losses this month, with an average return of –8.4%. The Nasdaq Sprott Junior Uranium Miners™ (NSURNJ™) posted the weakest return of the group, with a 17.1% loss driven by double-digit declines in some of its largest constituents in December, including Uranium Energy, NexGen Energy and Denison Mines. The Nasdaq Future Global Sustainability Leaders™ (NQFGSL™) recorded the smallest loss in the group, at 4.0%.
Nasdaq Dorsey Wright Indexes
The Nasdaq Dorsey Wright Indexes continued to exhibit the downward trend observed in other suites, with an average loss of 7.7% as the momentum factor in particular struggled in December. All 16 indexes finished in negative territory in December. The Dorsey Wright Emerging Markets Tech Leaders™ (DWAEM™) delivered the best return in the suite at –1.4%, whereas the Dorsey Wright Industrials Tech Leaders™ (DWIDX™) slid 13.2%.
Nasdaq Dividend and Income Indexes
All 15 indexes in the Dividend and Income suite posted losses this month, with an average decline of 5.2%. The Nasdaq Emerging Markets High Equity Income™ (NQEMHEI™) was the best performer with a mild loss of 0.4%, while the Nasdaq US SMID Cap Rising Dividend Achievers™ (NQDVSMR™) retreated by 10.0%.
Nasdaq Multifactor Indexes
All 11 indexes in the Multifactor suite posted losses this month, with an average decline of 6.9%. The best-performing index of the group was The Growth Strength™ (NQCAPSG™), falling only 5.4%. In comparison, theNasdaq AlphaDEX Mid Cap Core™ (NQDXUSMC™) turned in a monthly return of –8.2%, the lowest of the Multifactor suite.
Nasdaq Sector-Specific Indexes
All indexes in the Nasdaq Sector-Specific Indexes suite recorded losses this month, averaging a return of -8.5%. The KBW Financial Sector Dividend Yield™ (KDX™) was the best performer, registering a loss of only 6.2%, while the KBW Premium Yield Equity REIT™ (KYX™) registered a loss of 10.5%.
Nasdaq Options and Other Quantitative Indexes
The average return across the suite of indexes was 1.1%, with only two indexes in this group posting a loss. The Credit Suisse Nasdaq WTI Crude Oil FLOWS106 TR™ (QUSOITR™) gained 5.5% this month, the highest within the category. The Credit Suisse Nasdaq Silver FLOWS106 TR™ (QSLVOTR™) saw the steepest decline of the suite, recording losses of 4.7% in December.
Nasdaq Crypto Indexes
The Nasdaq Crypto Index suite generated an average loss of 5.2%. The Nasdaq Bitcoin™ (NQBTCS™) had the mildest loss of 4.1%. The Nasdaq Crypto US Settlement Price™ (NCIUSS™), Nasdaq Crypto™ (NCIS™) and Nasdaq Ethereum™ (NQETHS™) declined by 4.6%, 4.7%, and 7.2%, respectively.
Bitcoin largely continued its ascent through December, up nearly 40% from election day through year-end and breaking the key psychological level of $100,000 for the first time on Dec 4th. ETF inflows reflected the surge in the digital asset. The Blackrock iShares Bitcoin ETF (IBIT) reached the $50 billion milestone in just 11 months, overtaking the iShares Gold Trust (IAU) in total assets just three days following the election. Additionally, the $37.2 billion of inflows to the iShares Bitcoin ETF (IBIT) this year ranks third among all ETPs, trailing only the Vanguard S&P 500 ETF (VOO) and the iShares Core S&P 500 ETF (IVV) with inflows of $116.1 and $86.8 billion, respectively.
Disclaimer:
Nasdaq® is a registered trademark of Nasdaq, Inc. The information contained above is provided for informational and educational purposes only, and nothing contained herein should be construed as investment advice, either on behalf of a particular security or an overall investment strategy. Neither Nasdaq, Inc. nor any of its affiliates makes any recommendation to buy or sell any security or any representation about the financial condition of any company. Statements regarding Nasdaq-listed companies or Nasdaq proprietary indexes are not guarantees of future performance. Actual results may differ materially from those expressed or implied. Past performance is not indicative of future results. Investors should undertake their own due diligence and carefully evaluate companies before investing. ADVICE FROM A SECURITIES PROFESSIONAL IS STRONGLY ADVISED.
© 2024. Nasdaq, Inc. All Rights Reserved.

Latest articles

This data feed is not available at this time.
Data is currently not available