
Nasdaq Monthly Index Performance Commentary – April 2026
- The Nasdaq-100 Index® (NDX®) ended April higher by 15.6%—its best single month since October 2002 (18.9%).
- Market angst has receded given the fragile Iran war ceasefire and as negotiations attempt to progress. U.S equity volatility, as measured by the CBOE Nasdaq-100 Volatility Index (VXN), has fallen back below its 5-year average.
- It has been a solid Q1 2026 earnings season thus far as 50 out of 53 Nasdaq-100 companies have beaten EPS expectations (as reported by Factset) by an average of 16% with an index level growth rate of 51%.
- Nasdaq’s suite of indexes ended April with 125 out of 128 indexes tracked in our report posting gains and the average index up 9.8%.
Chart of the Month

Source: Nasdaq Global Indexes, Factset. Data as of May 1, 2026.
Executive Summary
The world and financial markets continue to watch for and price in the latest news flow amidst a cease fire and what have been confusing narratives concerning the ongoing Iran war negotiations. We are clearly not out of the woods yet. However, the market’s angst has receded further since our April monthly as U.S. equity volatility has fallen back below its 5-year average (as measured by VXN).
Although the Middle East conflict is in its second month, global EPS growth forecasts for 2026 have risen since the start of the year—particularly in the U.S. and emerging markets. Key profitability measures for the Nasdaq-100 remain strong over the past year, which speaks to the resiliency thus far of corporate America in the face of ongoing geopolitical uncertainties. The pivot back to fundamentals and the enthusiasm around the AI secular theme—which is not without its speed bumps (e.g., concerns around AI capex levels, impact on the software sector)—have driven the PHLX Semiconductor IndexTM (SOXTM) to an all-time high.
The U.S. consumer has been broadly resilient. Yet we are beginning to see the impact from higher energy prices as consumer confidence hit its lowest in 48 years of data and small business optimism moved lower—a bifurcation between equities hitting all-time highs versus very weak on-the-ground sentiment. While one month is not a trend, these latest data points, on top of a moderating employment backdrop and a stagnant housing market, have pushed 2026 U.S. consensus real GDP forecasts lower.
Mindful that the Iran war has resulted in one of the largest oil supply disruptions in history (per the International Energy Association (IEA)), the market spotlight is on Q1 2026 earnings season. 50 out of 53 companies that have reported have beaten EPS estimates (as reported by Factset). EPS growth has been 51% vs. an expected 22%. Notably, net income for Alphabet (GOOG & GOOGL) and Amazon (AMZN) were aided by increases in valuation in their stakes in Anthropic. Consequently, looking through the geopolitical volatility and notwithstanding the private equity valuation boost, U.S. corporate earnings continue to deliver which contributed to a supportive risk-taking environment for equities. More broadly, investors will continue to monitor for any impacts from higher energy prices which could weigh on outlooks and what have been lofty earnings expectations.
Nasdaq Indexes April 2026 Performance Recap
Among the 128 indexes tracked in this report, 125 finished April in positive territory, while 3 ended with negative returns. The best-performing index was the Nasdaq US Smart Semiconductor™ Index (NQSSSE™), delivering a return of 44.5%. The worst performance was from the PHLX Gold/Silver Sector™ Index (XAU™) which declined 4.3% for the month. The average return across all 128 indexes for the month was 9.8%.
Nasdaq Featured Indexes

All fourteen Nasdaq Featured Indexes registered positive returns in April. The Nasdaq-100 Dorsey Wright Momentum™ Index (NDXDWA™) was the top performer, with a return of 31.7% while the Nasdaq-100 Ex-Tech Sector™ Index (NDXX™) was the bottom performer in the group with a gain of 1.7%. Building on a strong rally that began at the end of March, the Nasdaq-100 Index® (NDX®) posted a return of 15.6% on receding tensions related to the US-Iran conflict and strong earnings results. Technology stocks (semiconductors in particular) had a strong month as the Nasdaq-100 Technology Sector™ Index (NDXT™) was up 23.5%. Larger cap names outperformed on a relative basis as the Nasdaq-100 Mega™ Index (NDXMEGA™) was up 17.5% and the Nasdaq-100 Equal Weighted™ Index (NDXE™) climbed 11.1%. Overall, this group of indexes rose by an average of 14.1%.
Nasdaq Global Indexes

Performance across the Nasdaq Global Indexes suite was strong as all nine indexes in the group posted positive returns for April. The best performer in the group was the Nasdaq ASPA Ex-Japan™ Index (NQASPAXJP™) which gained 14.7%. The Nasdaq Emerging Markets™ Index (NQEM™) was also a strong performer despite a stronger U.S. Dollar, rising 11.5%. Europe and US mid-caps were the relative underperformers though they still posted positive returns with the Nasdaq Europe™ Index (NQEU™) gaining 6.8% and the Nasdaq US Mid Cap™ Index (NQUSM™) rising by 6.2%. The Nasdaq Developed Markets Ex United States™ Index (NQDMXUS™) was up 10%. The Nasdaq Global™ Index (NQGI™) had a return of 10.1%. The average return for this group of indexes was 9.9%.
Nasdaq Sector-Specific Indexes

Five out of the six indexes within Nasdaq’s sector-specific indexes suite were positive. The KBW Nasdaq Bank™ Index (BKX™) was the top performer, gaining 10.2%—its largest monthly gain since the November 2024 U.S. elections-driven first by the initial U.S.-Iran ceasefire and then by broadly solid Q2 bank earnings. The bottom performer was the PHLX Gold/Silver™ Index (XAU™) which lost 4.3% in April, following a 20% loss in March. This two-month decline of 24.7% was the largest since the 25.6% drop during February-March of 2020. This recent sell-off was driven by a stronger dollar in March and higher Treasury yields in April—amidst higher energy costs and rising inflation expectations—which increased the opportunity cost of holding precious metals. The average return for the group was 17%.
Nasdaq Thematic Indexes

Overall performance across the Nasdaq Thematic Tech lineup was sharply positive with 25 out of the 26 indexes in the suite recording gains with an average gain of 12.4%. The pivot back to refocusing on the fundamentals and the beneficiaries of the AI led to extremely strong performance in semiconductor names as the Nasdaq US Smart Semiconductor™ Index (NQSSSE™) jumped by 44.5% and the PHLX Semiconductor™ Index (SOX™) was higher by 38.4% to reach a new all-time high—its largest monthly increase since February 2000 (50.4%). Relatedly, the AI trade was strong with the Nasdaq CTA Artificial Intelligence™ Index (NQINTEL™) rising 23.5%. Cybersecurity names were still positive though their performance was muted relative to the rest of the suite. The ISE Cyber Security™ Index (HXR™) gained 6.8% while the Nasdaq CTA Cyber Security™ Index (NQCYBR™) rose 7.7%. The BVP Nasdaq Emerging Cloud™ Index (EMCLOUD™) was down 0.8% making it the worst performer in the suite.

Fifteen out of the sixteen indexes in the Nasdaq Thematic Renewables and Energy Transition Materials suite posted gains this month, with an average return of 11%. The Nasdaq Sprott Lithium Miners™ Index (NSLITP™) was the top performer in the group with a 28.8% return. A renewed focus on clean energy and smart grid infrastructure drove the Nasdaq Clean Edge Green Energy™ Index (CELS™) and the Nasdaq Global Electrification and Smart Grid™ Index (NQGETS™) higher by 26.1% and 24.1% respectively. Other metals including nickel and copper saw price gains. The Nasdaq Sprott Nickel Miners™ Index (NSNIKL™) was up 11.6% while the Nasdaq Sprott Junior Copper Miners™ Index (NSCOPJ™) had a return of 7.8%. The Nasdaq Junior Silver Miners™ Index (NMFSM™) was the bottom performer, losing 1.2%.

The Nasdaq Crypto suite continued its rally, posting an average gain of 10.6% with all four indexes in positive territory. The Nasdaq Bitcoin Settlement Price™ Index (NQBTCS™) led the group with a gain of 12.7% while the lowest returning index was the Nasdaq Ether Settlement Price™ Index (NQETHS™) which was up 8%.
Nasdaq Quantitative Indexes
Across the index suites comprising Nasdaq’s quantitative offerings, all 53 indexes posted gains in April, averaging a 7.5% return.
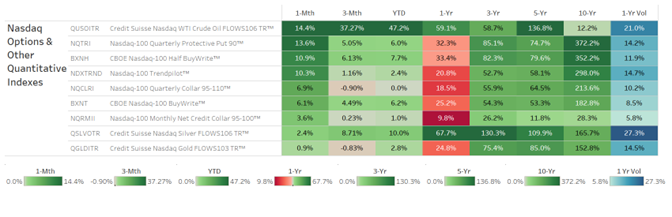
All nine indexes in the Nasdaq Options & Other Quantitative suite saw gains with an average return of 7.7%. The Credit Suisse Nasdaq WTI Crude Oil FLOWS106 TR™ Index (QUSOITR™) was the top performer with a return of 14.4%.

All thirteen Nasdaq Multifactor indexes were positive this month with an average return of 5.7%.

Within the Dorsey Wright momentum suite, the Dorsey Wright Technology Tech Leaders™ Index (DWTY™) was the best performer, up 28.7%. The Dorsey Wright Energy Tech Leaders™ Index (DWEN™) was the bottom performer, gaining 2.9%. Overall, all sixteen indexes in the suite were positive with an average gain of 10.9%.

All fifteen indexes in the Nasdaq Dividend and Income suite posted gains this month, with an average return of 5.6%. The Nasdaq Technology Dividend™ Index (NQ96DIVUS™) topped the group with a gain of 15.1%. The lowest performer in the group was the Nasdaq Victory Dividend Accelerator ™ Index (NQVDIV™) which was up 2.8% for the month.
Disclaimer:
Nasdaq® is a registered trademark of Nasdaq, Inc. The information contained above is provided for informational and educational purposes only, and nothing contained herein should be construed as investment advice, either on behalf of a particular security or an overall investment strategy. Neither Nasdaq, Inc. nor any of its affiliates makes any recommendation to buy or sell any security or any representation about the financial condition of any company. Statements regarding Nasdaq-listed companies or Nasdaq proprietary indexes are not guarantees of future performance. Actual results may differ materially from those expressed or implied. Past performance is not indicative of future results. Investors should undertake their own due diligence and carefully evaluate companies before investing. ADVICE FROM A SECURITIES PROFESSIONAL IS STRONGLY ADVISED.
Information set forth contains forward-looking statements that involve a number of risks and uncertainties. Nasdaq cautions readers that any forward-looking information is not a guarantee of future performance and that actual results could differ materially from those contained in the forward-looking information. Forward-looking statements can be identified by words such as “will,” “may”, and other words and terms of similar meaning. Such forward-looking statements include, but are not limited to, statements related to future activities and results. Forward-looking statements involve a number of risks, uncertainties or other factors beyond Nasdaq’s control. These risks and uncertainties are detailed in Nasdaq’s filings with the U.S. Securities and Exchange Commission, including its annual reports on Form 10-K and quarterly reports on Form 10-Q which are available on Nasdaq’s investor relations website at http://ir.nasdaq.com/ and the SEC’s website at http://www.sec.gov/. Nasdaq undertakes no obligation to publicly update any forward-looking statement, whether as a result of new information, future events or otherwise.
© 2026. Nasdaq, Inc. All Rights Reserved.

Latest articles

This data feed is not available at this time.
Data is currently not available