
Electronic Arts (NASDAQ:EA) is set to report its earnings on Tuesday, May 6, 2025. Historically, Electronic Arts (EA) stock has shown an equal likelihood of moving up or down on the day following its earnings announcements. Over the past five years, the stock experienced positive one-day returns in 50% of instances, with a median gain of 2.3%. Conversely, it saw negative one-day returns in the other 50% of instances, with a median loss of -4.7%.
For event-driven traders, while the historical data suggests a balanced probability, understanding these patterns could still inform trading strategies, particularly when considered alongside market expectations. Two common approaches exist:
- Pre-Earnings Positioning: Analyze the historical odds of positive or negative returns to establish a position before the earnings release.
- Post-Earnings Correlation Analysis: Examine the historical relationship between the immediate stock reaction to earnings and its subsequent medium-term performance to guide positioning after the announcement.
Ahead of the upcoming earnings report, consensus estimates project earnings per share (EPS) of $0.91 on revenue of $1.55 billion. This represents a year-over-year decrease in revenue compared to the prior year period, which saw earnings of $0.67 per share on revenue of $1.67 billion. The anticipated revenue decline is likely due to continued softer gaming demand.
From a fundamental perspective, Electronic Arts currently has a market capitalization of $38 billion. Its revenue over the trailing twelve months was $7.3 billion, and the company maintains operational profitability with $1.5 billion in operating profits and a net income of $1.0 billion.
That said, if you seek upside with lower volatility than individual stocks, the Trefis High Quality portfolio presents an alternative – having outperformed the S&P 500 and generated returns exceeding 91% since its inception.
See earnings reaction history of all stocks

Photo by JESHOOTS.COM on Unsplash
Electronic Arts’ Historical Odds Of Positive Post-Earnings Return
Some observations on one-day (1D) post-earnings returns:
- There are 20 earnings data points recorded over the last five years, with 10 positive and 10 negative one-day (1D) returns observed. In summary, positive 1D returns were seen about 50% of the time.
- Notably, this percentage increases to 58% if we consider data for the last 3 years instead of 5.
- Median of the 10 positive returns = 2.3%, and median of the 10 negative returns = -4.7%
Additional data for observed 5-Day (5D), and 21-Day (21D) returns post earnings are summarized along with the statistics in the table below.
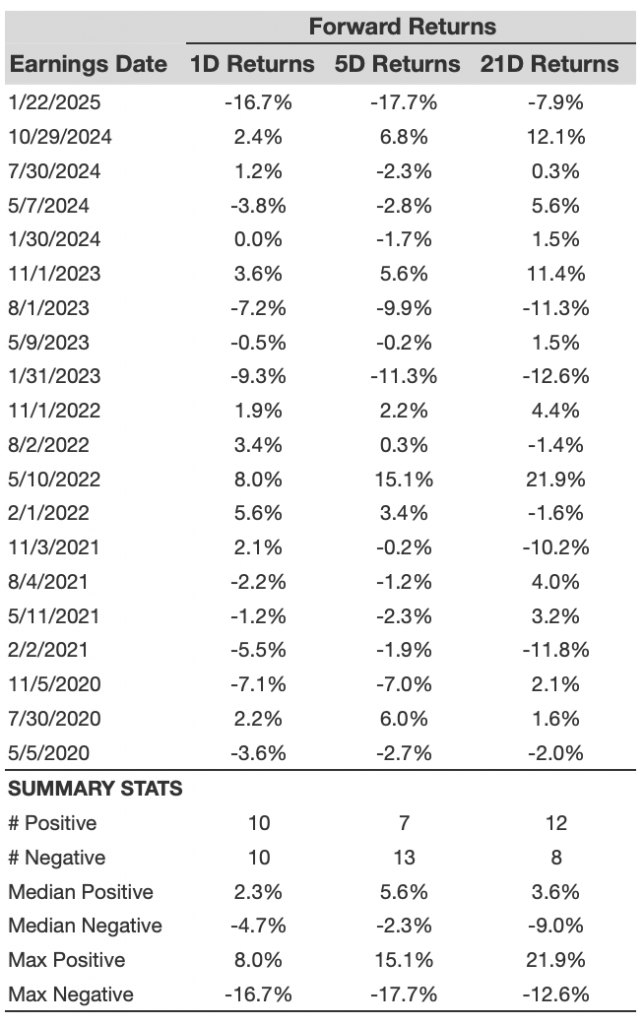
EA 1D, 5D, and 21D Post Earnings Return
Correlation Between 1D, 5D, and 21D Historical Returns
A relatively less risky strategy (though not useful if the correlation is low) is to understand the correlation between short-term and medium-term returns post earnings, find a pair that has the highest correlation, and execute the appropriate trade. For example, if 1D and 5D show the highest correlation, a trader can position themselves “long” for the next 5 days if 1D post-earnings return is positive. Here is some correlation data based on 5-year and 3-year (more recent) history. Note that the correlation 1D_5D refers to the correlation between 1D post-earnings returns and subsequent 5D returns.
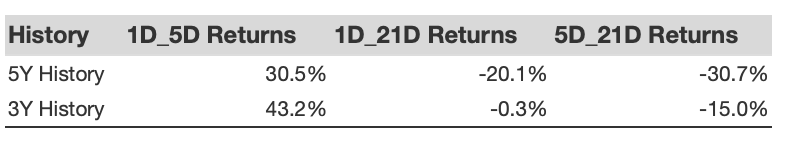
EA Correlation Between 1D, 5D and 21D Historical Returns
Is There Any Correlation With Peer Earnings?
Sometimes, peer performance can have influence on post-earnings stock reaction. In fact, the pricing-in might begin before the earnings are announced. Here is some historical data on the past post-earnings performance of Electronic Arts stock compared with the stock performance of peers that reported earnings just before Electronic Arts. For fair comparison, peer stock returns also represent post-earnings one-day (1D) returns.
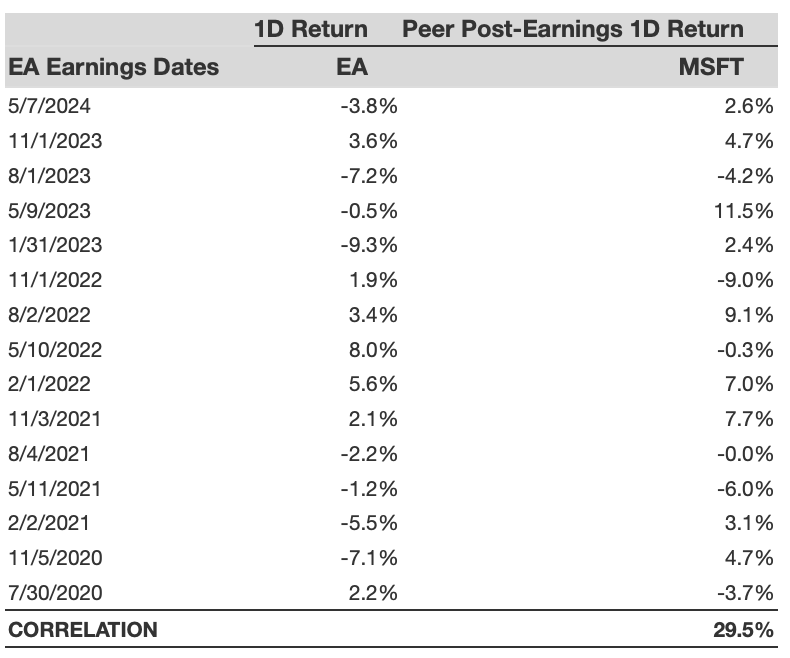
EA Correlation With Peer Earnings
Learn more about Trefis RV strategy that has outperformed its all-cap stocks benchmark (combination of all 3, the S&P 500, S&P mid-cap, and Russell 2000), to produce strong returns for investors. Separately, if you want upside with a smoother ride than an individual stock like Electronic Arts, consider the High Quality portfolio, which has outperformed the S&P, and clocked >91% returns since inception.
Invest with Trefis Market-Beating Portfolios
See all Trefis Price Estimates
The views and opinions expressed herein are the views and opinions of the author and do not necessarily reflect those of Nasdaq, Inc.

