
The S&P 500 (SNPINDEX: ^GSPC) measures the performance of 500 large U.S. companies that account for 80% of domestic equities by market capitalization. For that reason, the index is commonly used as a benchmark for the entire U.S. stock market.
Investors can learn a great deal by analyzing the historical performance of the S&P 500. For instance, the index returned 1,710% over the past three decades, compounding at 10.1% annually. That lengthy time period covers a variety of different market environments, from economic booms to recessions, so investors can reasonably expect similar returns over the next three decades.
However, there are different ways to comb through data, and different lessons to be learned from those analyses. Read on to see the average S&P 500 return in every month of the year.
The average S&P 500 return in every month of the year
The S&P 500 was expanded to include 500 stocks in March 1957. But S&P Global applies the selection criteria in retrospect to generate hypothetical performance data for the index dating back to January 1928.
The following chart shows the average S&P 500 return in each month between January 1928 and December 2023.
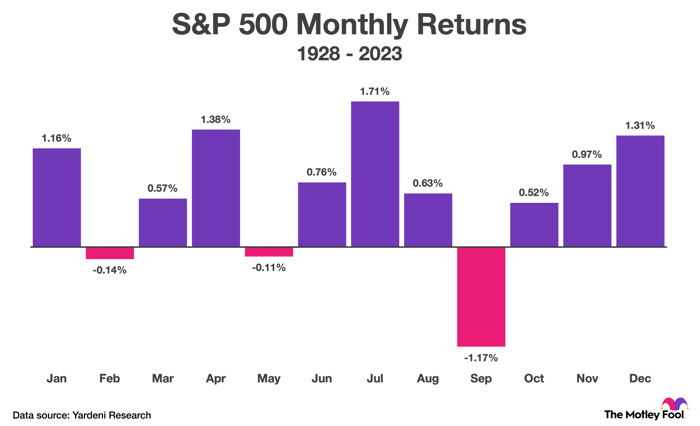
Chart by Author.
Investors can learn a few lessons from the chart above. First, the stock market goes up more often than it goes down. The S&P 500 has historically been a profitable investment in nine of the 12 months in the year, and the declines have been negligible during two of the down months.
Second, a common axiom warns investors to sell in May and go away. The rationale is that stocks tend to cool through the summer months before returning to growth in the fall, but there is no merit to that conventional wisdom. The S&P 500 usually moves higher between June and August, and July has historically been the single best month of the year for the index.
Third, the September Effect is quite real. The S&P 500 has historically fallen sharply in September, but it has also rebounded abruptly in the subsequent months, presumably because of enthusiasm about holiday spending. Regardless, investors can use that information to their advantage by keeping cash on hand to buy stocks during September.
There is another important lesson not readily apparent in the chart: The probability of a positive return in the S&P 500 increases as holding period lengthens, as we'll see.
The S&P 500 has been profitable over every 20-year period in history
In total, there were 1,152 months between January 1928 and December 2023, and the S&P 500 generated a positive return in 682 of those months. That means the index was a profitable investment on a monthly basis about 59% of the time during the past 96 years. Those odds aren't much better than a coin toss.
However, the probability of a positive return in the S&P 500 improves as holding period lengthens:
|
Holding Period |
Odds of a Positive Return in S&P 500 |
|---|---|
|
1 month |
59% |
|
1 year |
69% |
|
5 years |
79% |
|
10 years |
88% |
|
20 years |
100% |
Data source: Bloomberg, Crestmont Research, Yardeni Research. Shown is the odds of a positive return in the S&P 500 over different time periods based on data collected between 1928 and 2023.
The S&P 500 has been a profitable investment over every rolling 20-year period since 1928. That means owning an S&P 500 index fund for at least two decades has always been a profitable investment strategy.
There's one more thing investors should know. The S&P 500 outperformed virtually every other asset class on the planet over the past five, 10, and 20 years, according to data from Morgan Stanley. That includes equities in Europe, Asia, and emerging markets. It also includes U.S. and international bonds, as well as precious metals and real estate.
The conclusion: The S&P 500 has a very favorable risk-reward profile over long periods of time, and investors would be hard pressed to find another asset class better equipped to build life-changing wealth. To that end, an S&P 500 index fund is a great choice for most investors, especially in addition to a portfolio of individual stocks.
Should you invest $1,000 in S&P 500 Index right now?
Before you buy stock in S&P 500 Index, consider this:
The Motley Fool Stock Advisor analyst team just identified what they believe are the 10 best stocks for investors to buy now... and S&P 500 Index wasn't one of them. The 10 stocks that made the cut could produce monster returns in the coming years.
Stock Advisor provides investors with an easy-to-follow blueprint for success, including guidance on building a portfolio, regular updates from analysts, and two new stock picks each month. The Stock Advisor service has more than tripled the return of S&P 500 since 2002*.
*Stock Advisor returns as of January 29, 2024
Trevor Jennewine has no position in any of the stocks mentioned. The Motley Fool has positions in and recommends S&P Global. The Motley Fool has a disclosure policy.
The views and opinions expressed herein are the views and opinions of the author and do not necessarily reflect those of Nasdaq, Inc.

