
DailyFX.com -
Gold/Silver Highlights:
- Gold posting bearish price sequence below long-term resistance
- Silver broke support last week, respecting it as resistance now
- Both major precious metals look headed lower in the days ahead
To view the longer-term technical and fundamental outlook for Gold , or to see our top trade ideas for 2018, check out the DailyFX Trading Guides.
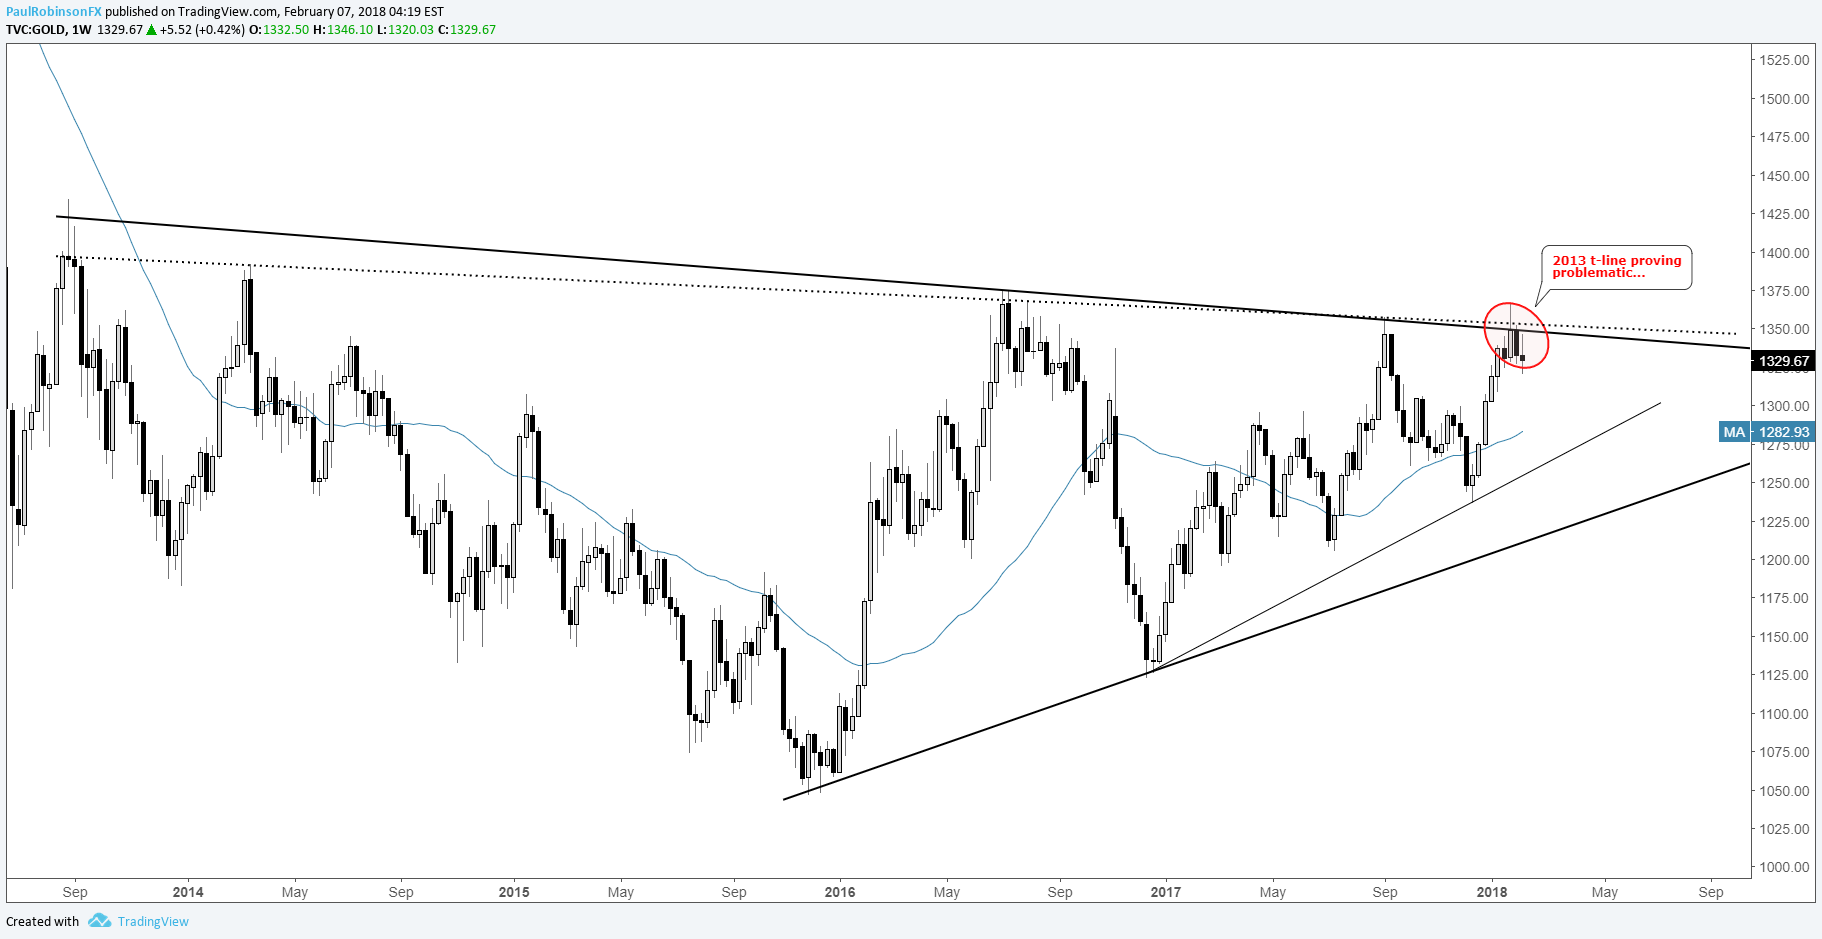
Gold posting bearish price sequence below long-term resistance
Gold has been struggling around the 2013 trend-line for several weeks, failing to post a weekly close beyond the threshold. There has been only one time it closed above on a daily basis, back on 1/24, not enough to qualify as a break. This keeps the 'line-in-the-sand' relatively clear - stay below, neutral to bearish; trade above, neutral to bullish.
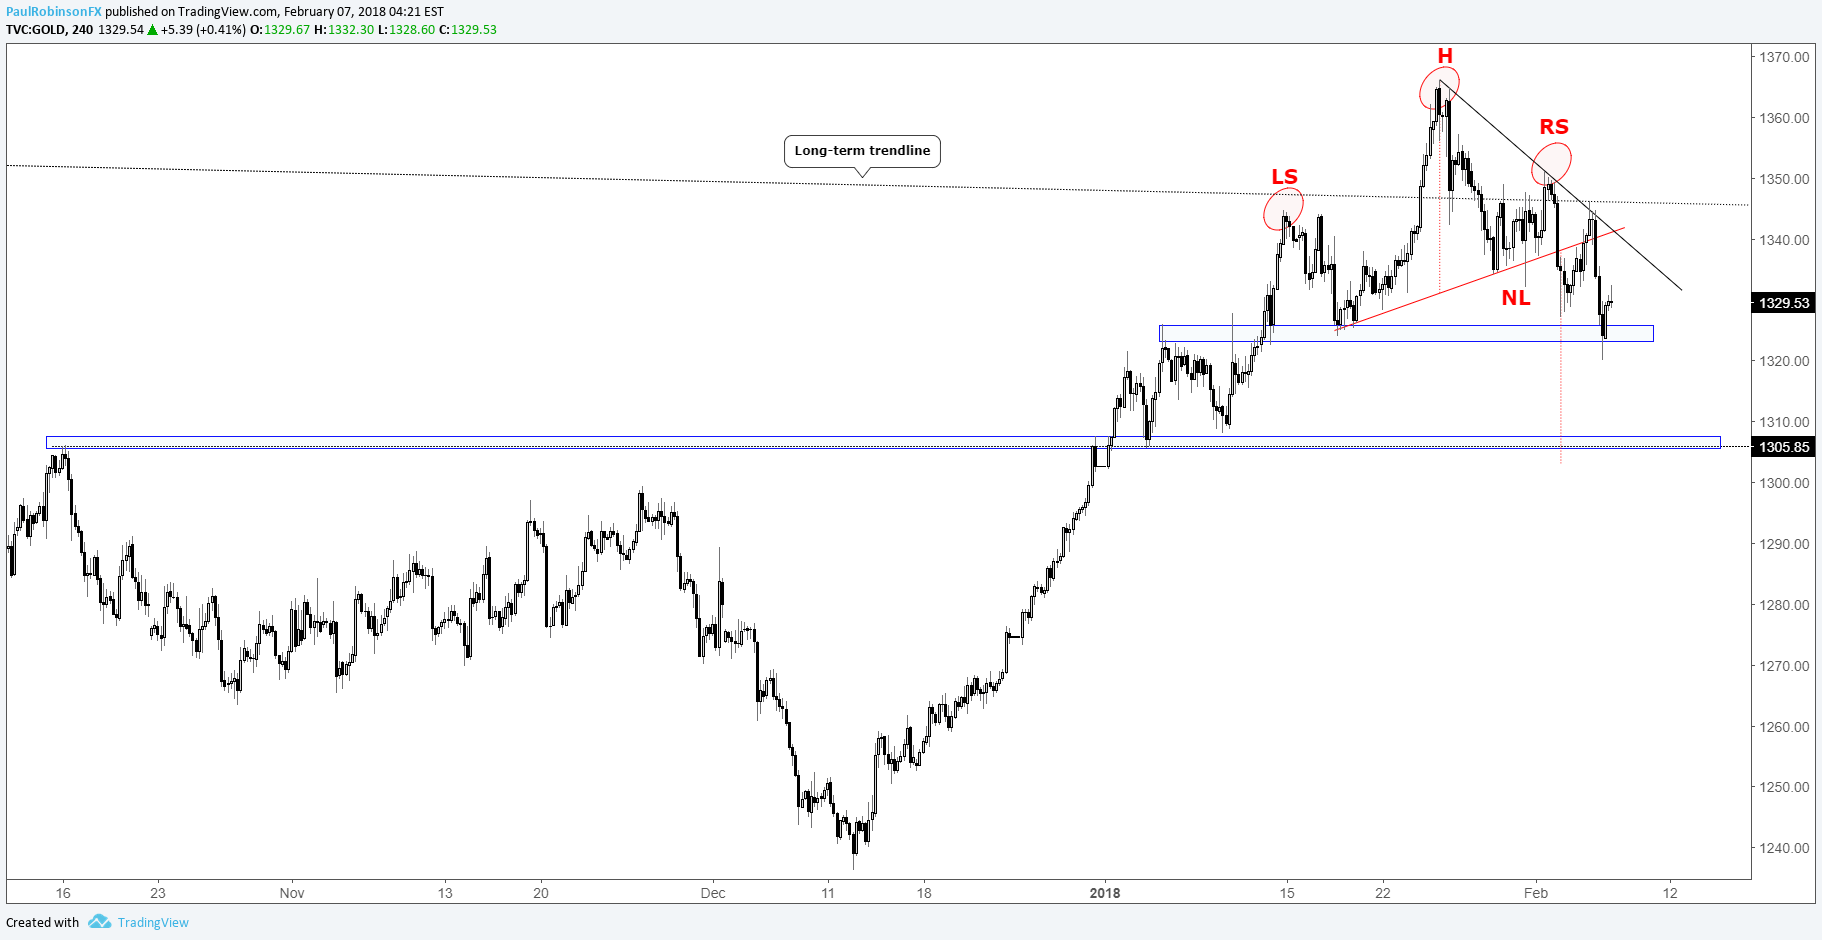
Dialing in a little closer, looking at the 4-hr chart, there is a 'head-and-shoulders' pattern which triggered the other day, and was thoroughly tested yesterday before gold was rejected lower. This has minor support in play around 1320, but should that break then look for the area around 1305 as the next level of support. The height of the H&S formation points to a measured move to around 1303.
To turn the bearish outlook upside down, a solid break above the 2013 trend-line will be needed on a weekly basis given the long-term nature of the trend-line.
Check out this guide for ideas on Building Confidence in Trading
Gold Weekly Chart
Gold 4-hr Chart
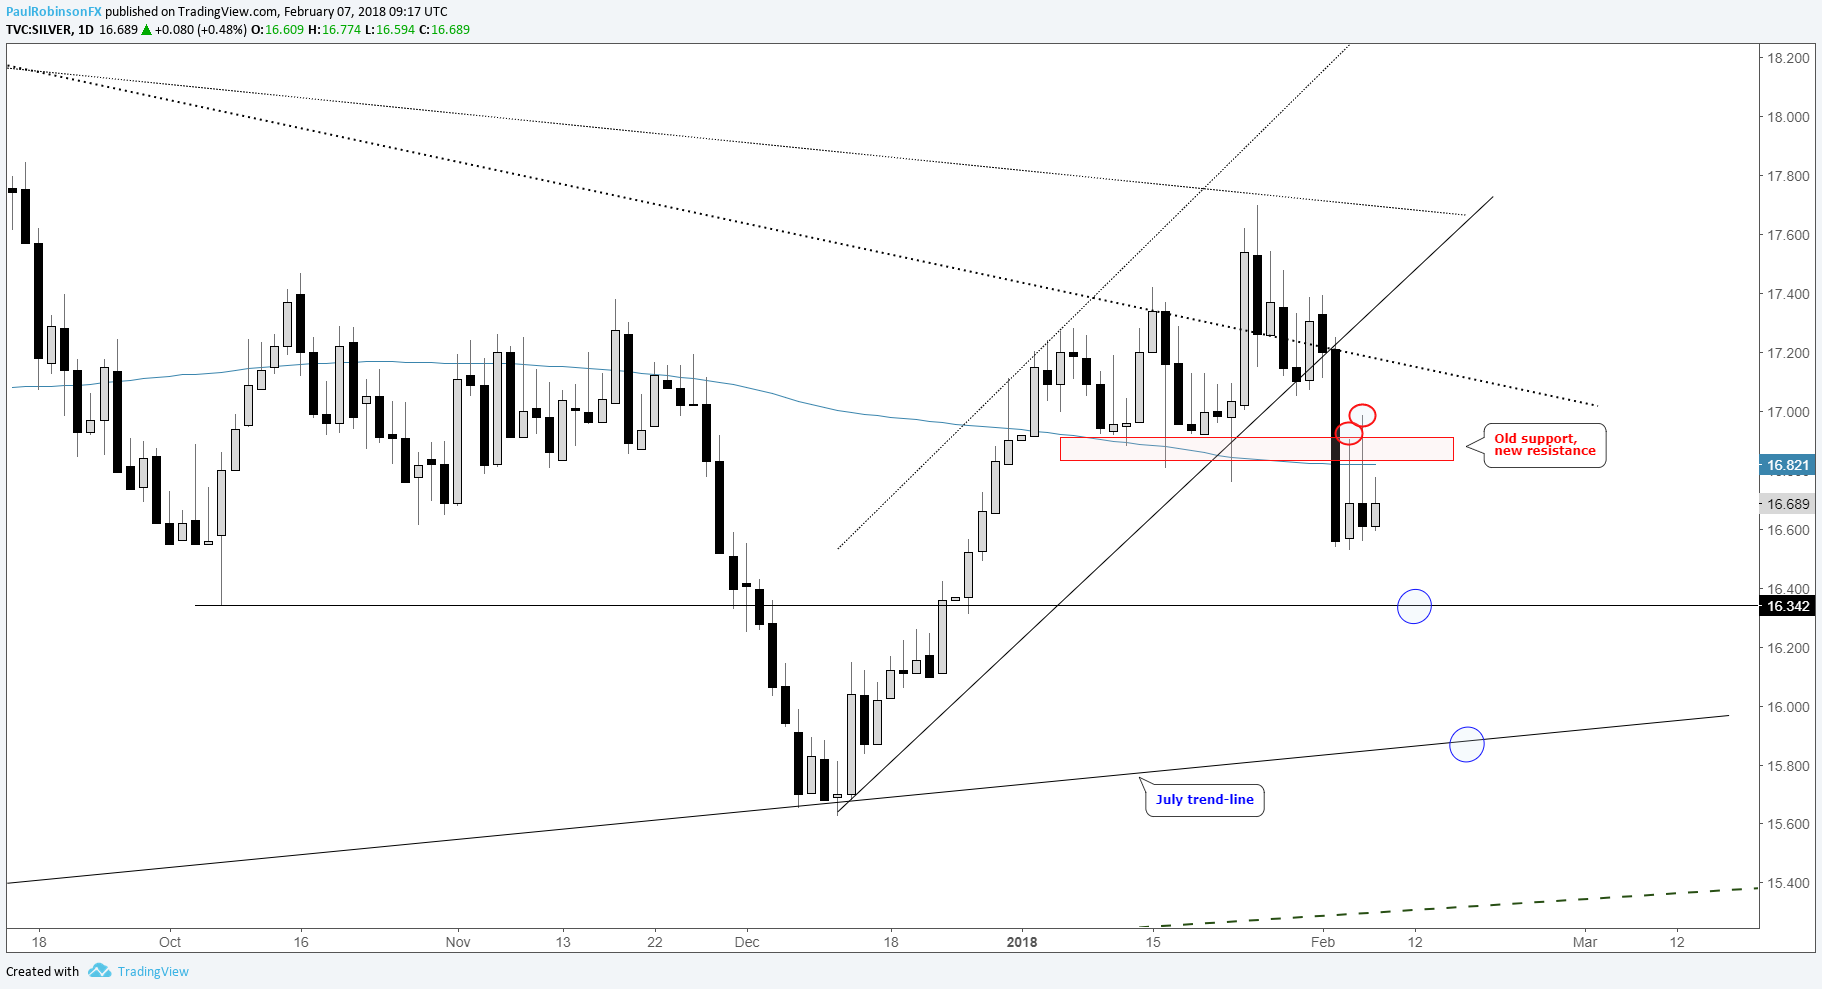
Silver broke support last week, respecting it as resistance now
Silver failed hard on Friday, sending it below a few daily lows created last month, along with the 200-day which had been passing through the vicinity. Two days in a row we've seen rallies fail, with yesterday the bigger failure of the two.
The 'old support, new resistance' theme we discuss regularly is in play here. If the failures are to hold true then it shouldn't be too long from now that we see another round of selling. There aren't any great lines of support until the July trend-line, with 16.34 as one potential source of support between here and there.
Silver Daily Chart
Trader Resources
Whether you are a new or experienced trader, we have several resources available to help you; indicator for tracking trader sentiment , quarterly trading forecasts , analytical and educational webinars held daily, trading guides to help you improve trading performance, and one specifically for those who are new to forex .
---Written by Paul Robinson, Market Analyst
To receive Paul's analysis directly via email, please SIGN UP HERE
You can follow Paul on Twitter at @PaulRobinsonFX
DailyFX provides forex news and technical analysis on the trends that influence the global currency markets.
Learn forex trading with a free practice account and trading charts from IG .
The views and opinions expressed herein are the views and opinions of the author and do not necessarily reflect those of Nasdaq, Inc.
The views and opinions expressed herein are the views and opinions of the author and do not necessarily reflect those of Nasdaq, Inc.
