
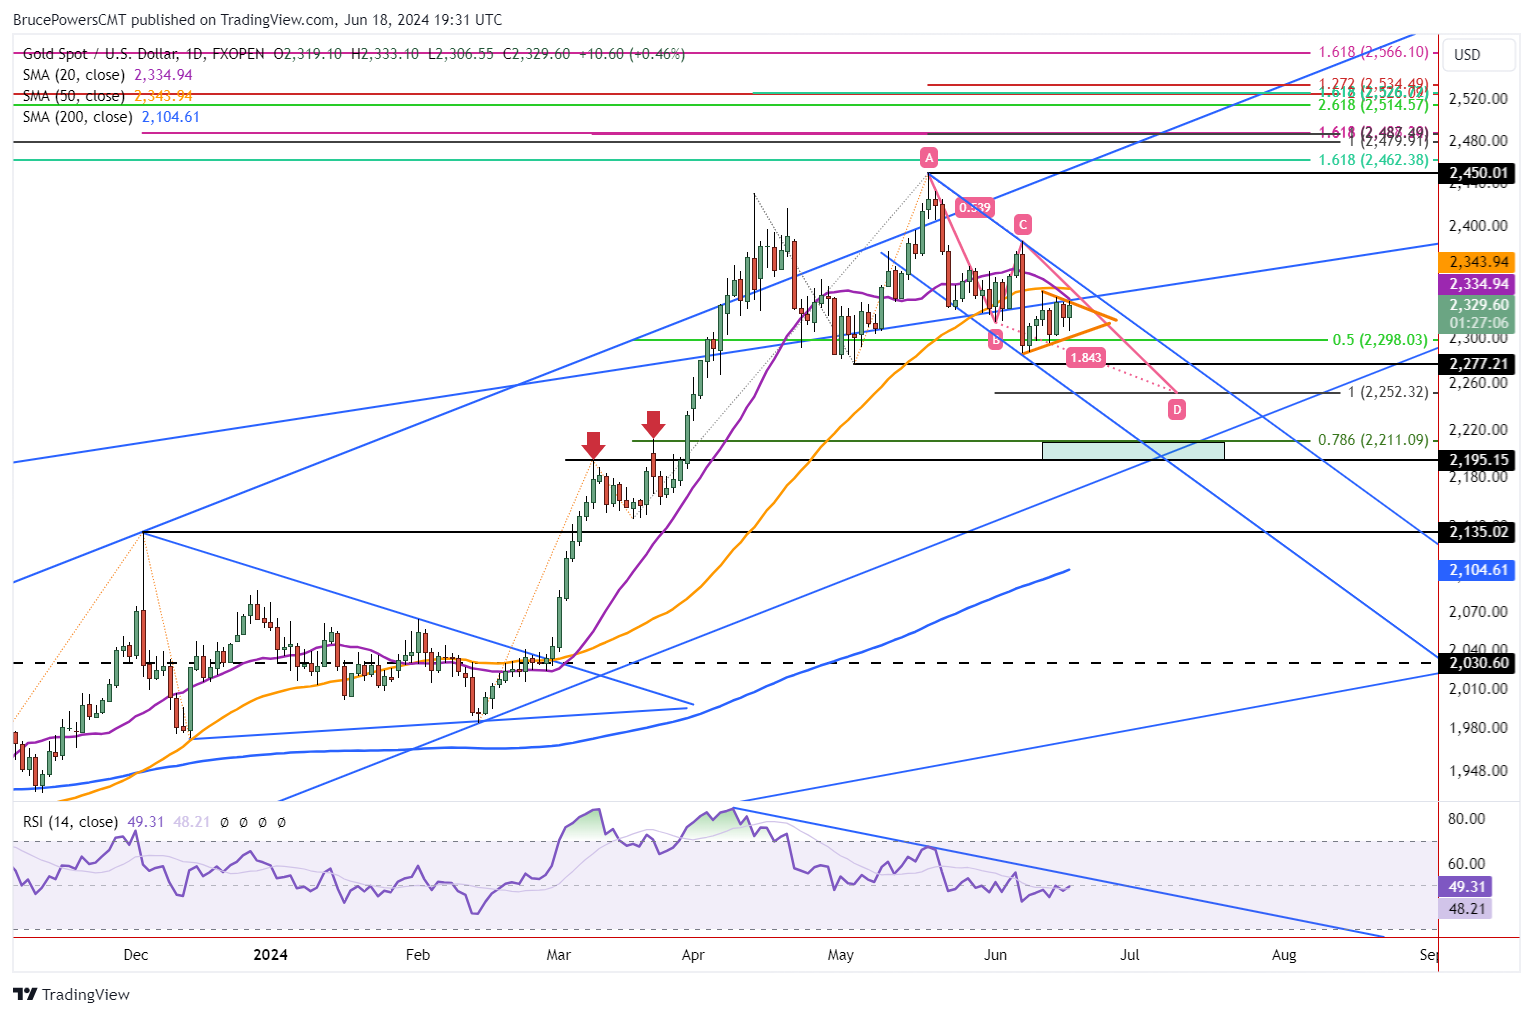
Volatility in the price of gold has been contracting as it has formed a potential bear pennant consolidation pattern. It follows a sharp one-day drop from the 2,388-swing high (C), which generated the pole to go along with the pennant. This pattern is considered bearish as it has formed within a larger decline (retracement). Nonetheless, if a bullish breakout occurs the pattern may morph into a larger or different pattern.
Resistance at 2,342
The recent minor swing high of 2,342 defines the top resistance level for the current seven-day consolidation pattern. Therefore, a breakout above the level would provide more confidence than a move above a boundary line. Further, the 50-Day MA (orange) is currently acting as resistance at 2,344. It should be considered along with the 2,342 high as a breakout above both price levels is needed for a bullish signal. Given where the price of gold is sitting relative to the apex of the symmetrical pennant triangle, a move out of the pattern is likely within the next several days.
Bearish Trend Pattern
Certainly, the trend pattern in gold for the short-term looks bearish. A bearish trend continuation pattern (pennant) has formed just below resistance of the 50-Day MA. The 50-Day line had been indicating support previously. Other signs of weakness include the 20-Day MA (purple) crossing below the 50-Day a couple days ago. Also, a top rising trend channel line had previously been acting as support but is now being tested as resistance. Once support breaks after holding for a while it will likely be tested as resistance to some degree. After that dynamic is complete a bear market is ready to proceed.
Reality Needs a Signal
Nevertheless, anything can happen regardless of the pattern. A pattern breakout needs a signal to confirm the pattern. On the downside, a drop below last Thursday’s low of 2,296 will trigger a breakdown from the bear pennant. The next lower target at 2,252 completes a declining ABCD pattern. While further down is a price zone starting from around 2,211. If gold gets that low also keep an eye on its relationship to the uptrend line.
For a look at all of today’s economic events, check out our economic calendar.
This article was originally posted on FX Empire
More From FXEMPIRE:
- Flipster and TON Announce Exciting New Partnership
- Natural Gas News: Traders Focus on Weather Forecasts for Price Guidance
- Gold Price Forecast – Gold Continues to See Support on Holiday
The views and opinions expressed herein are the views and opinions of the author and do not necessarily reflect those of Nasdaq, Inc.

