It is no secret that short-dated index options have taken the trading world by storm over the past couple of years. Most of the focus is on very short-dated index options that have a day or less to expiration. We have historically found trading opportunities are more likely in places where traders are not focused. This wrap-up of Nasaq-100 (NDX) option price behavior covers the price action using options with between one and five days to expiration. A major finding is the contrast in behavior of NDX options with one day remaining to expiration versus those that expire between three and five days. As traders continue to explore methods of utilizing short-dated index options, looking beyond one day to expiration may be a good place to start.
Methods
For each time to expiration, we explore the at-the-money (ATM) straddle pricing on the close versus the value of the ATM straddle at expiration. For long and short straddle performance, 2.00 points of slippage is incorporated into the results. We believe this method shows closer to real world outcomes for straddle buyers and sellers. This method also results in both long and short straddle traders possibly losing money over the same period. Finally, the straddle is settled based on the NDX straddle value at option expiration.
1-Day Straddles
Our first look at 1-Day NDX ATM straddles covers activity in 2023. Note a consistent straddle seller would lose just over 142 points in 2023. This approach would profit during five months in 2023 with September 2023 representing the best month for 1-Day straddle sellers with a potential gain of 424 points.
Table 1 – 2023 1-Day Short ATM Straddle Performance
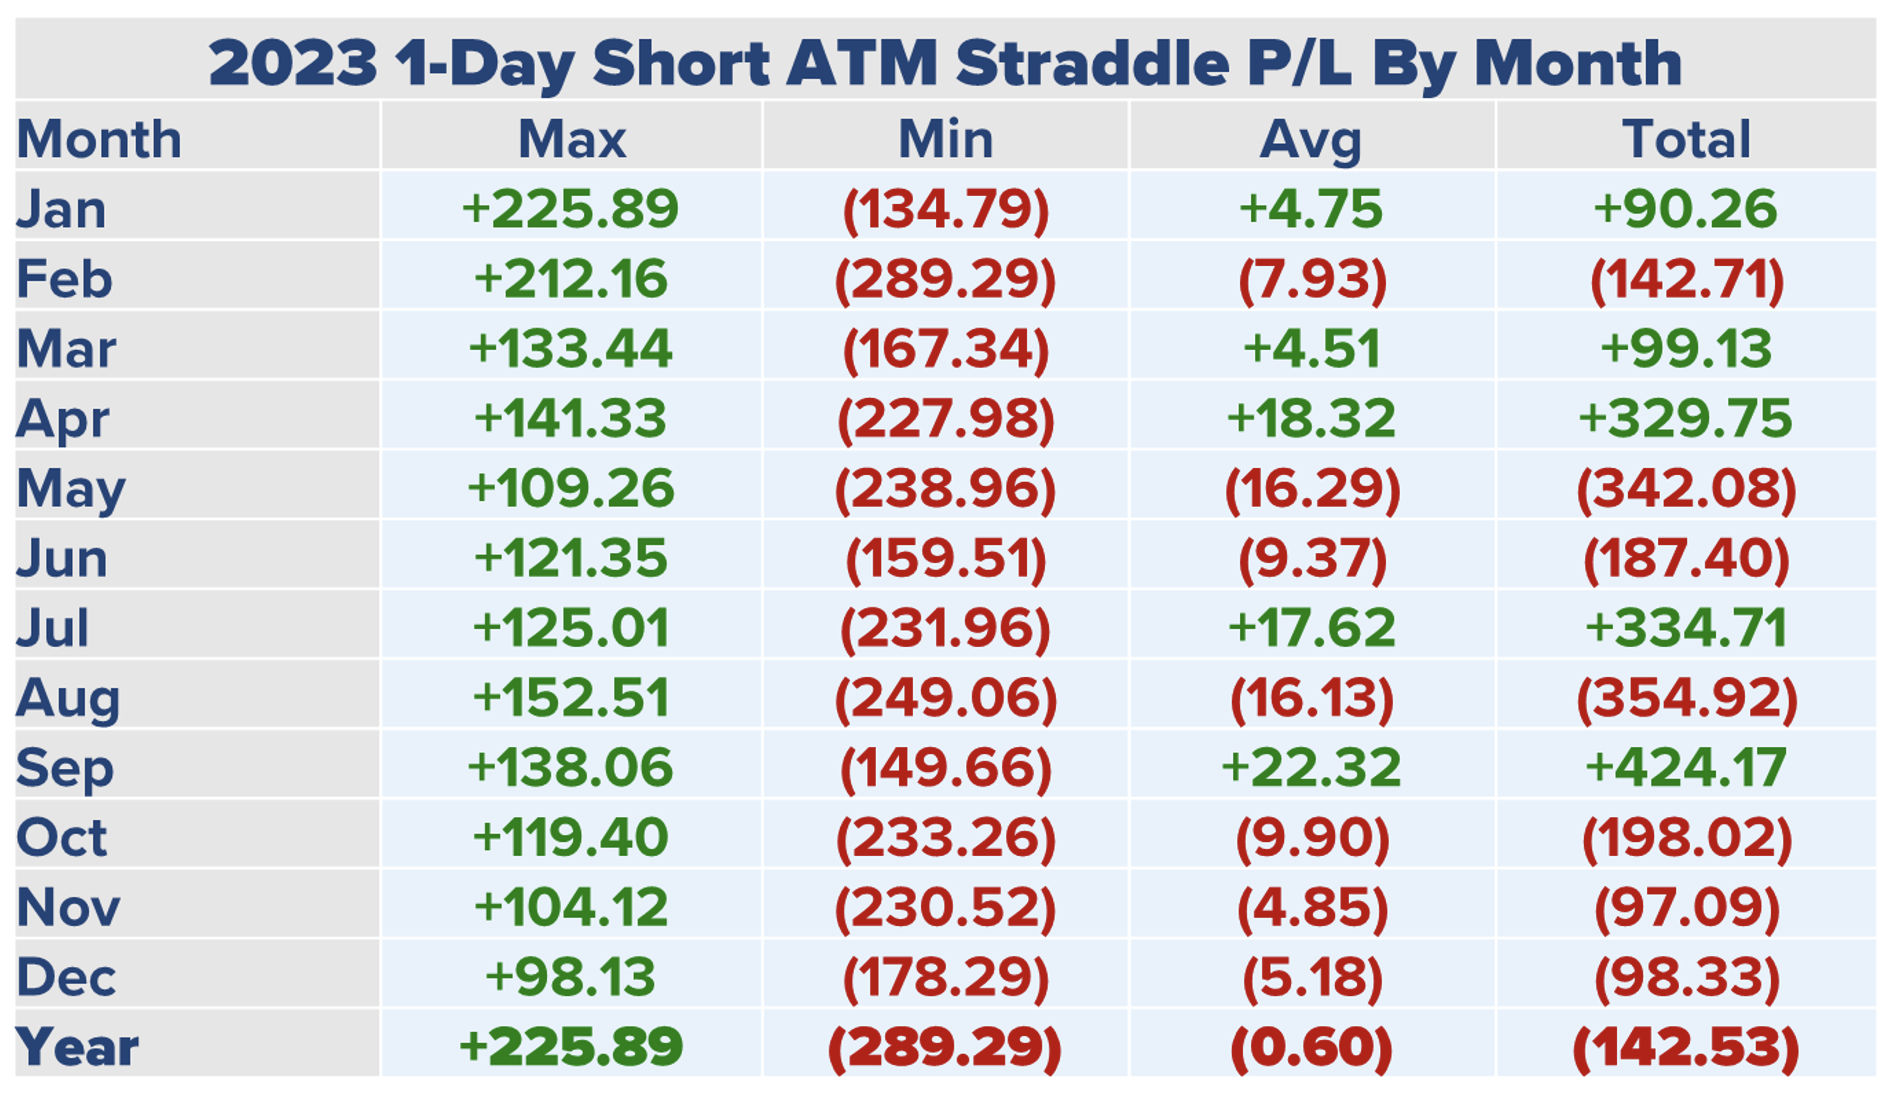
Data Sources: Bloomberg & Author Calculations
September 2023 was the best month for 1-Day straddle sellers, but all six months since the have resulted in loses, although March 2024 came close to being profitable with about 37.00 points in losses.
Table 2 – Q12024 1-Day Short ATM Straddle Performance
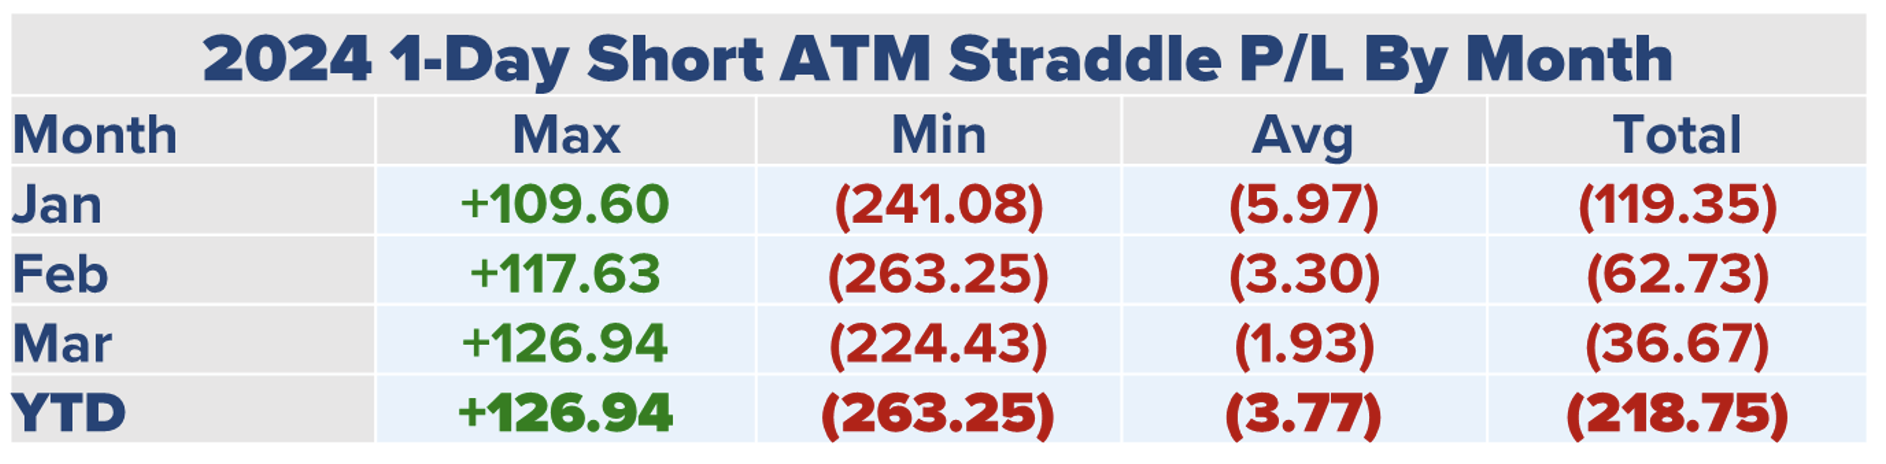
Data Sources: Bloomberg & Author Calculations
Recall, 2.00 points of slippage is included into our Straddle P/L analysis, Incorporating the cost of trading impacts results where long 1-Day straddle performance is negative as well. In 2023, consistently buying a 1-Day straddle and holding through expiration was profitable seven of twelve months. However, the losses during the other five months were greater than the profits during the good months.
Table 3 – 2023 1-Day Long ATM Straddle Performance
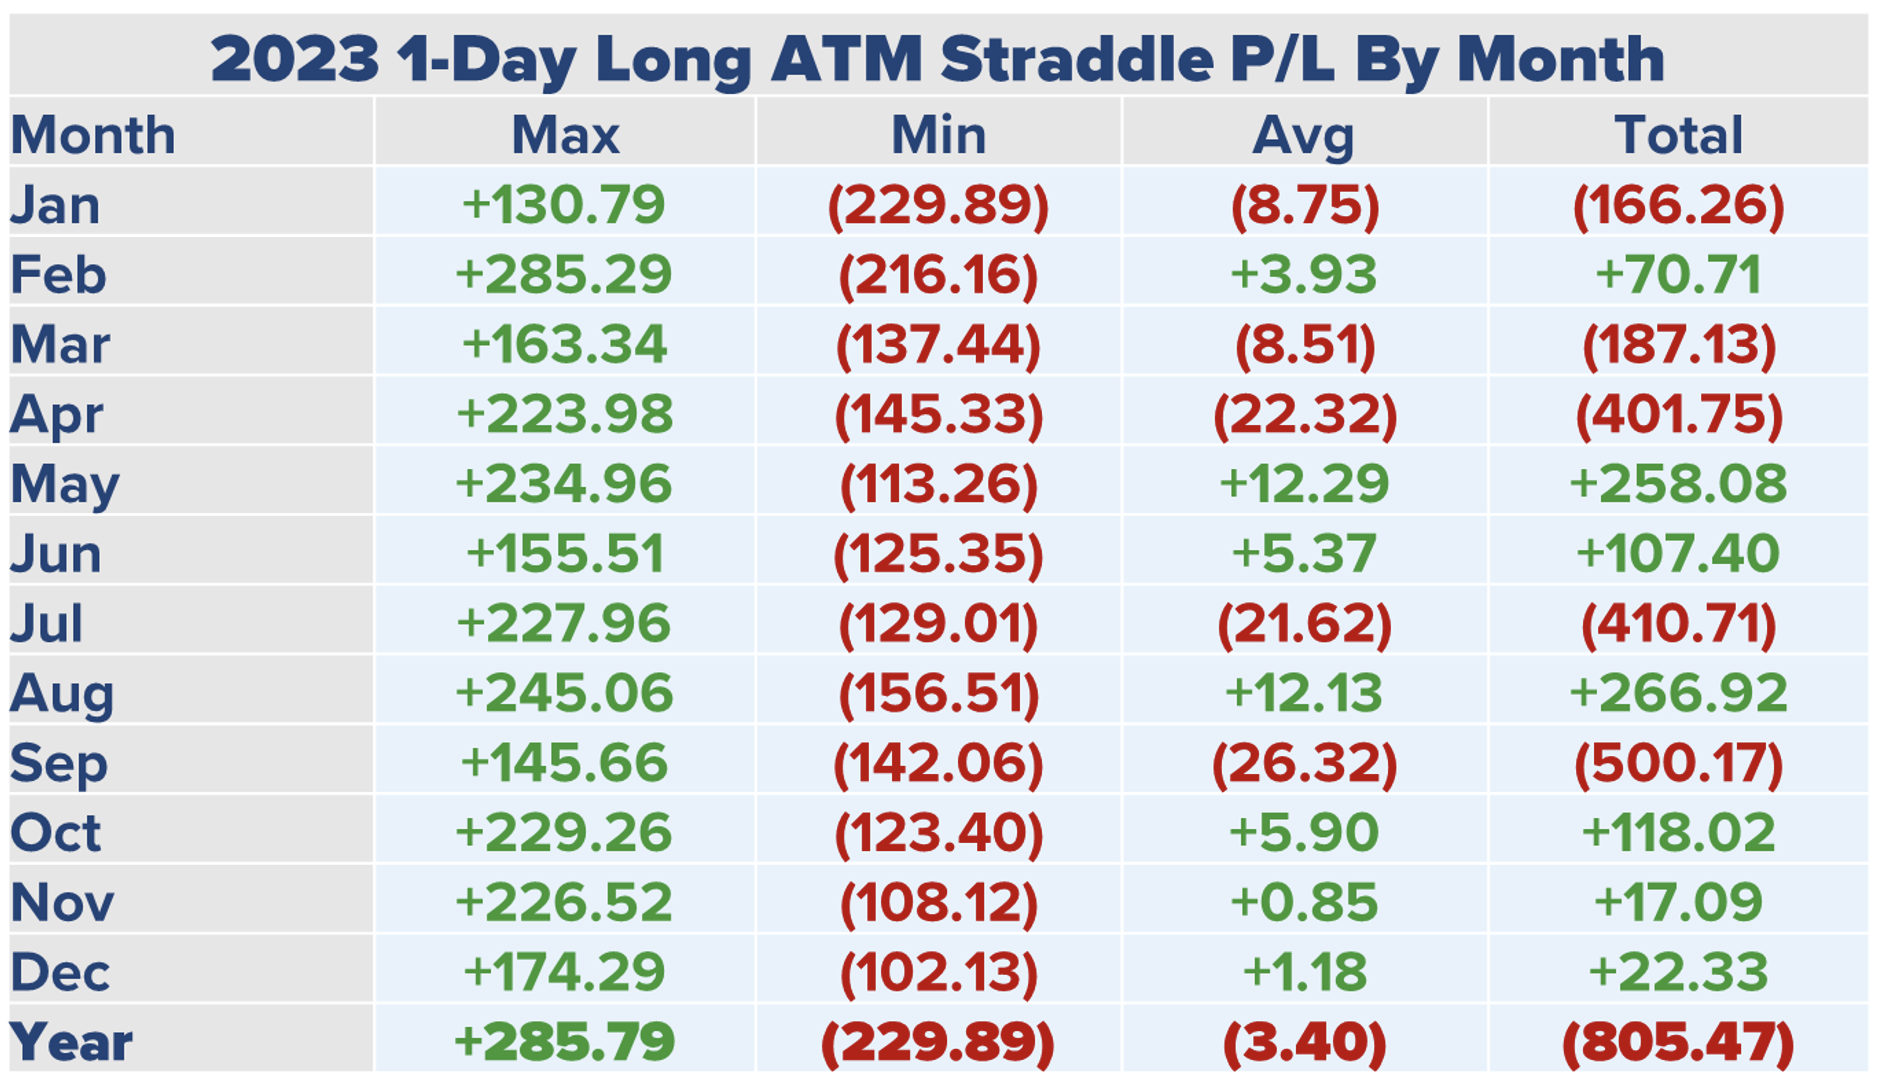
Data Sources: Bloomberg & Author Calculations
A consistent long 1-Day straddle approach was profitable for the fourth month in a row in January 2024, but by mid-March this approach switched from a year-to-date gain to a loss. There were two significant gains for straddle buyers in January 2024. The first was January 18, when NDX gained 1.47% and the other was January 31 when NDX was almost 2% higher on the day.
Table 4 – Q12024 1-Day Long ATM Straddle Performance
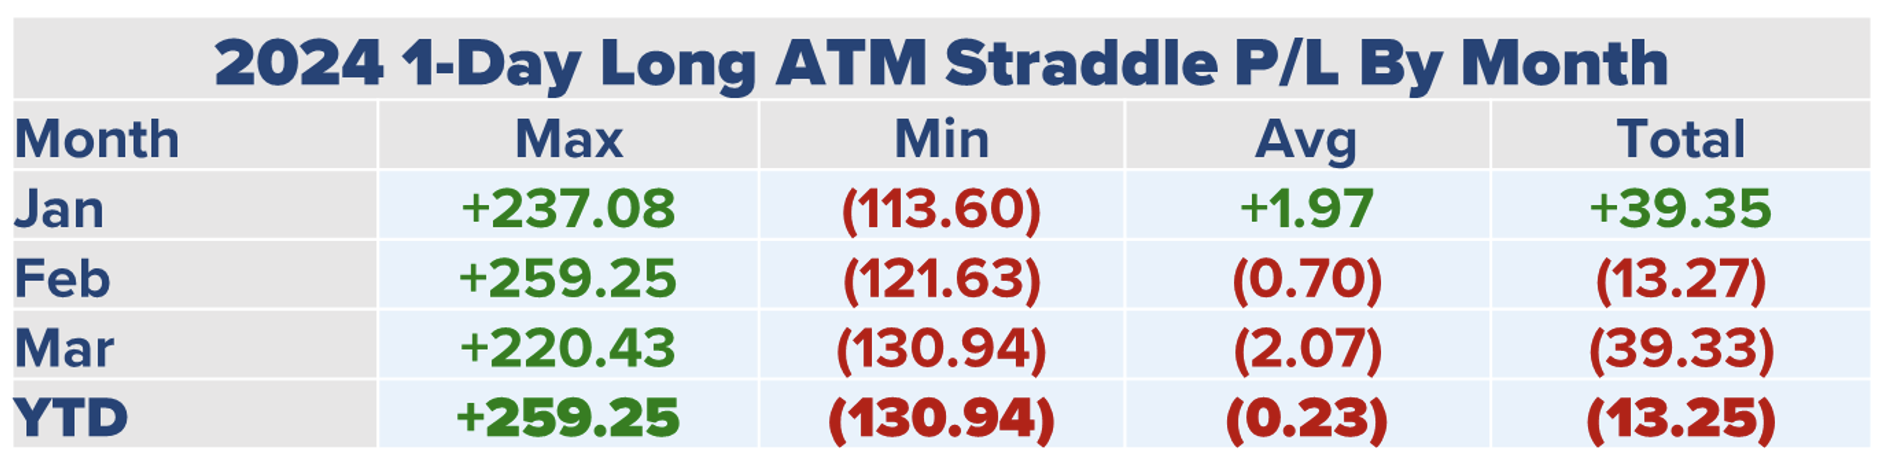
Data Sources: Bloomberg & Author Calculations
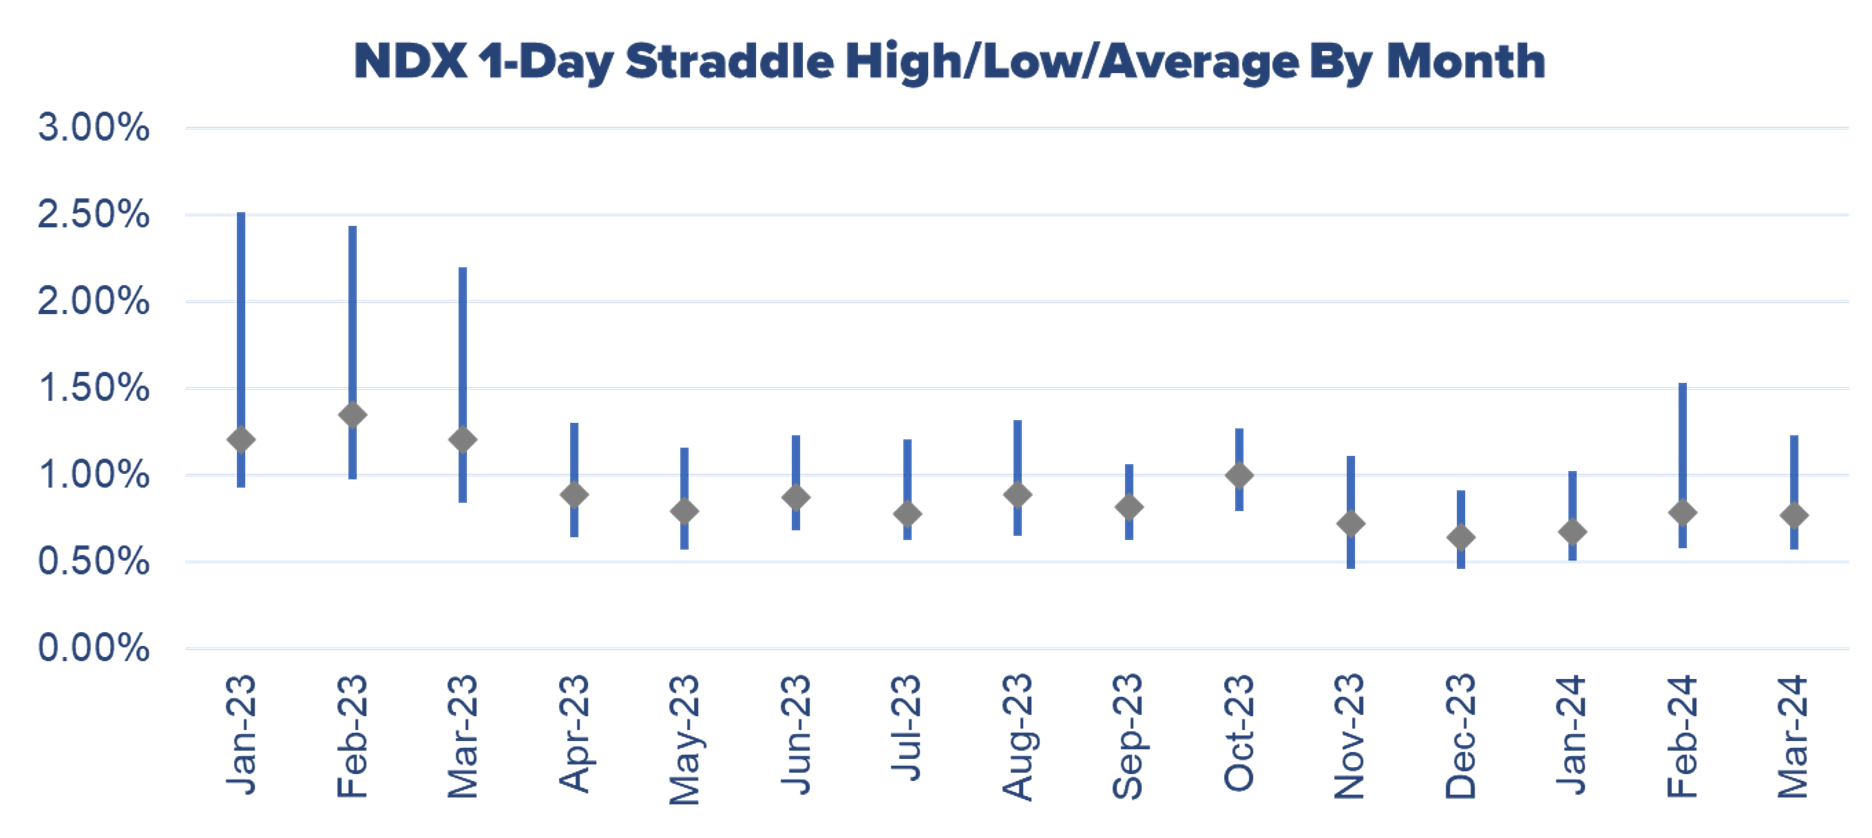
In addition to performance of long and short straddles, we monitor the straddle pricing as a percentage of the underlying index for each time frame. The graphic in Figure 1 shows the high, low, and average price of a 1-Day ATM straddle by month spanning January 2023 through March 2024.
Figure 1 – 1-Day ATM Straddle Pricing By Month
Data Sources: Bloomberg & Author Calculations
The average price was lower in January than the two most recent months, likely contributing to the losses for long straddles occurring in February and March. Note the first three months in 2023 experienced higher average straddle pricing than the following 12 months, something that is likely a function of high volatility experienced in 2022.
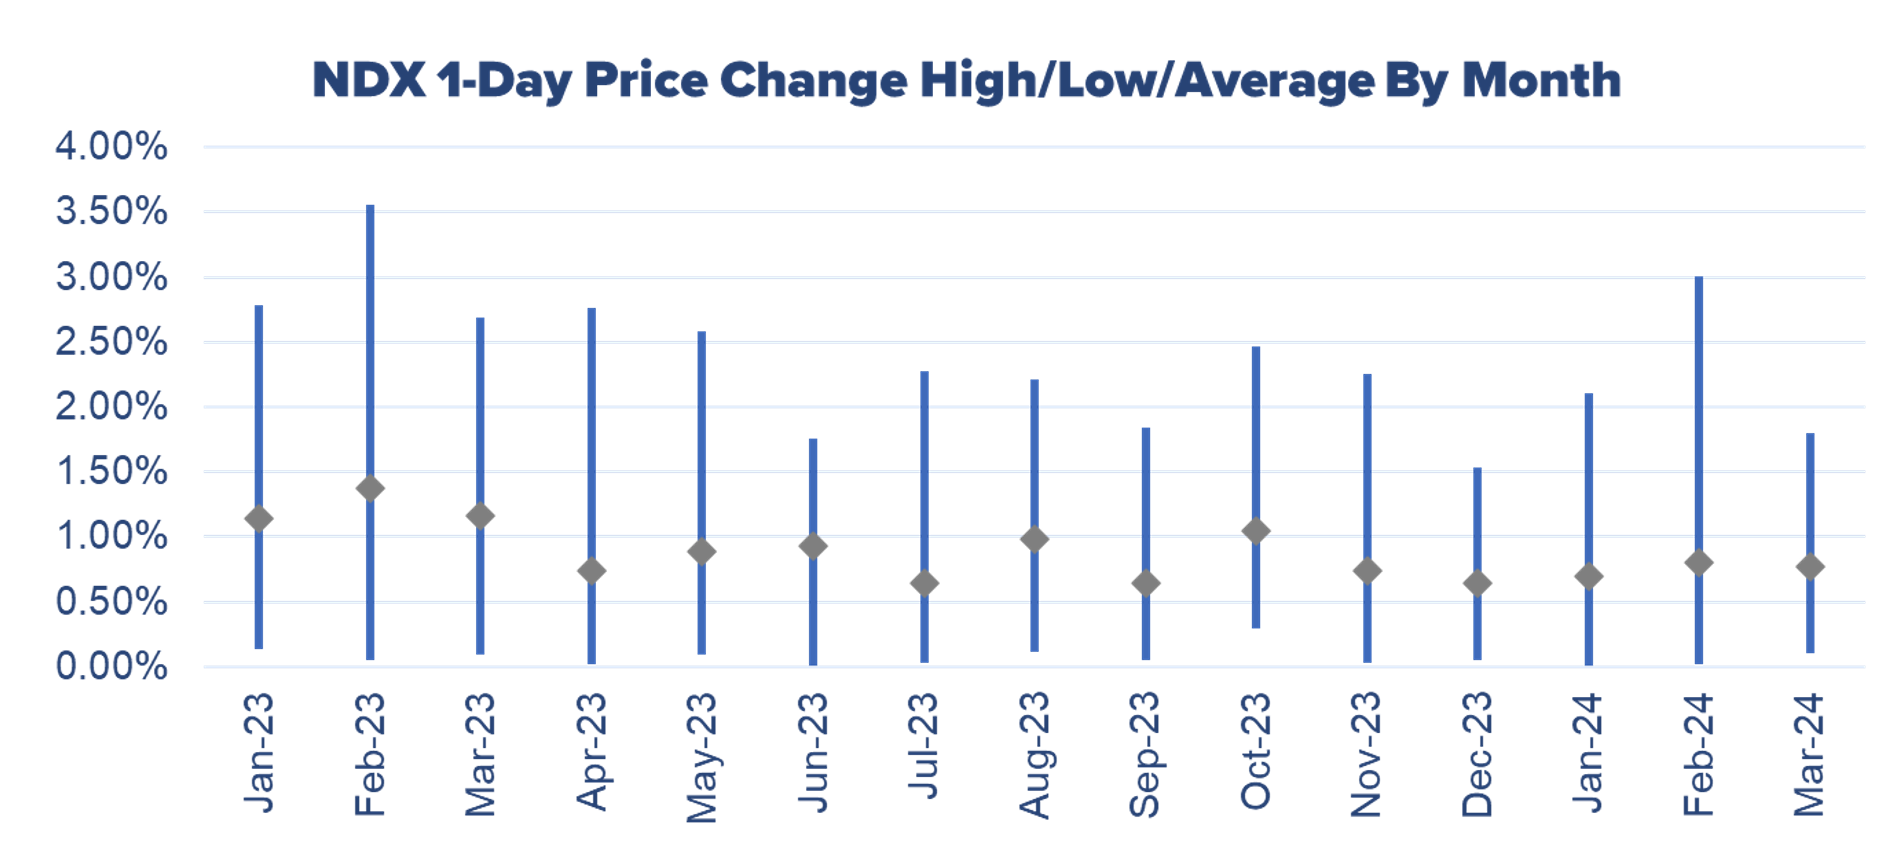
Figure 2 shows the daily high, low, and average price move for NDX in absolute value terms. Straddle traders would care most about the magnitude of price changes and these figures are appropriate to compare to average straddle pricing.
Figure 2 – 1-Day Price Change Behavior By Month
Data Sources: Bloomberg & Author Calculations
The average price change topped 1.00% in January, February, and March 2023, doing so again in October 2024. As expected, those four months are also the highest average straddle pricing months as the market adjusted premiums based on higher average daily price changes.
2-Day Straddles
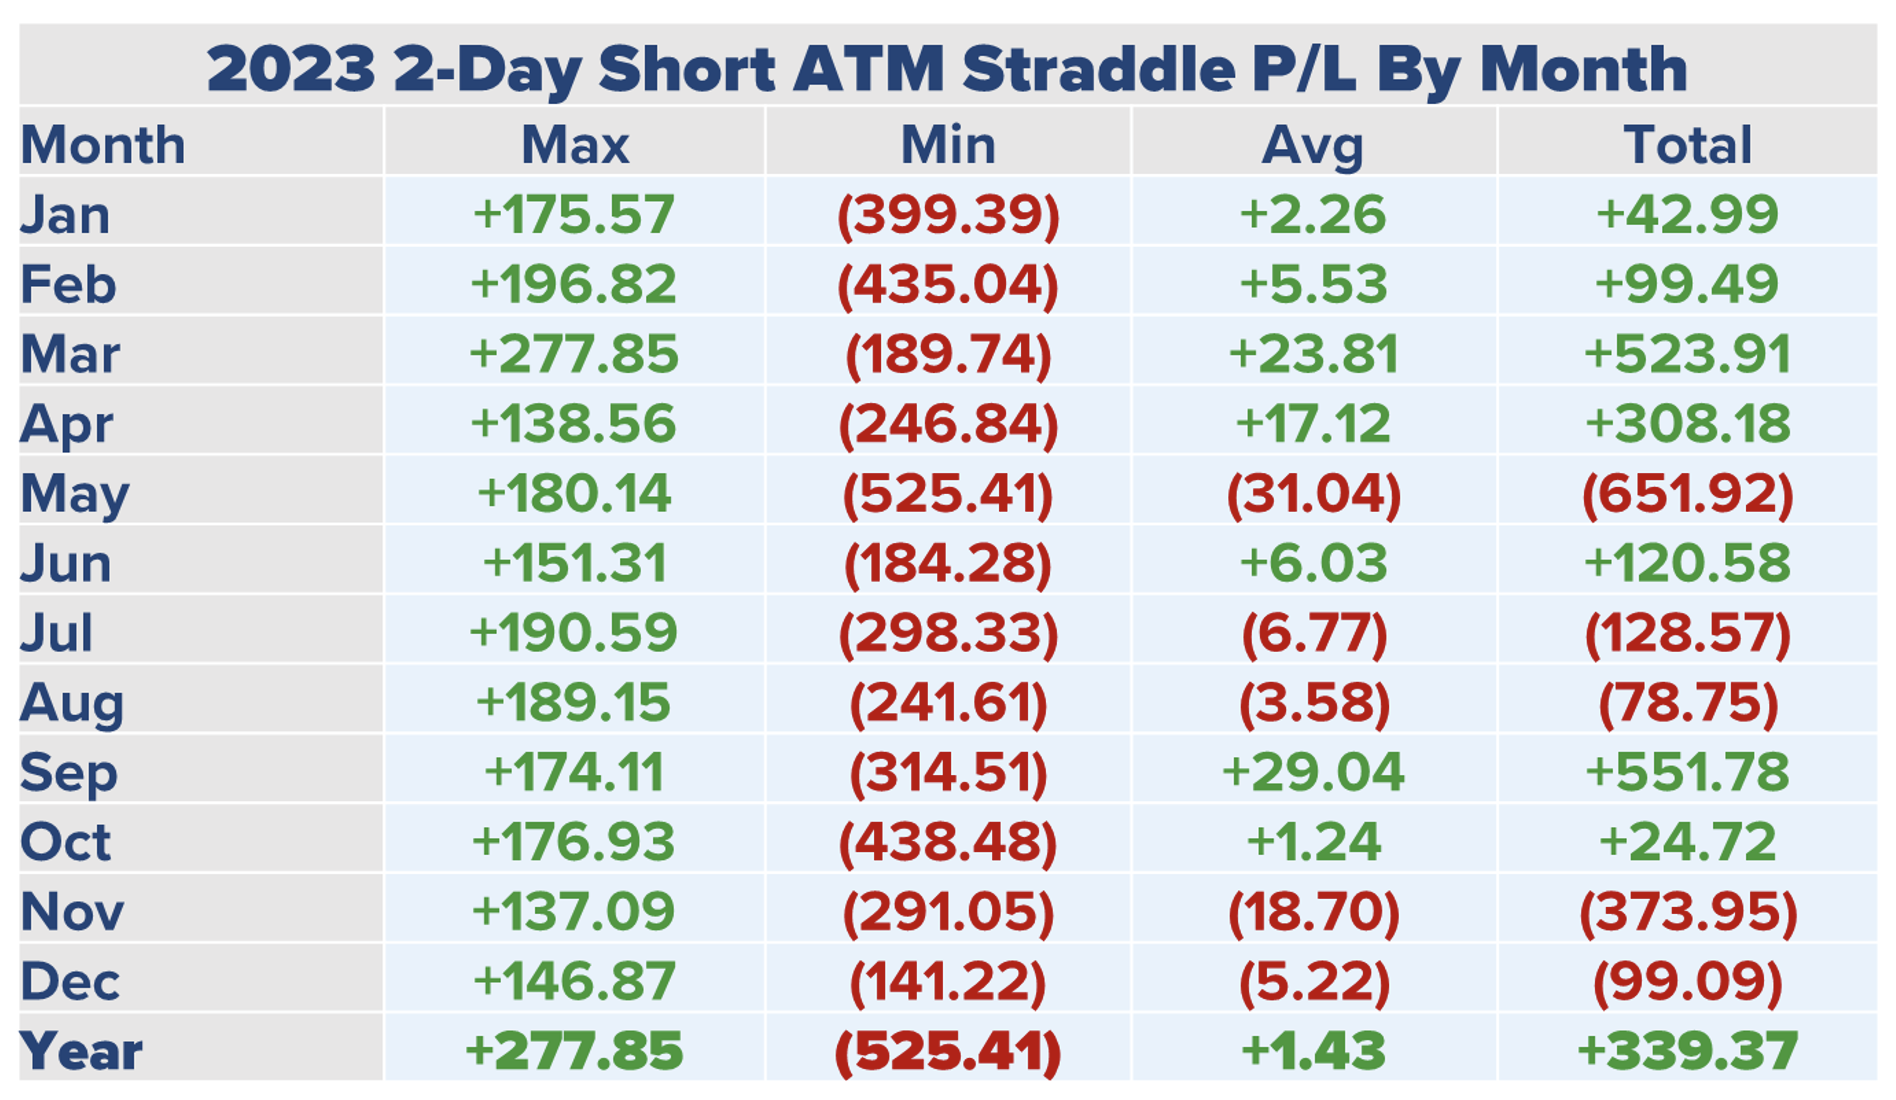
In 2023, consistently shorting 2-Day ATM straddles was profitable seven of twelve months. Also, this approach was mildly profitable in 2023 gaining 339 points. However, this performance did not continue in 2024.
Table 5 – 2023 2-Day Short ATM Straddle Performance
Data Sources: Bloomberg & Author Calculations
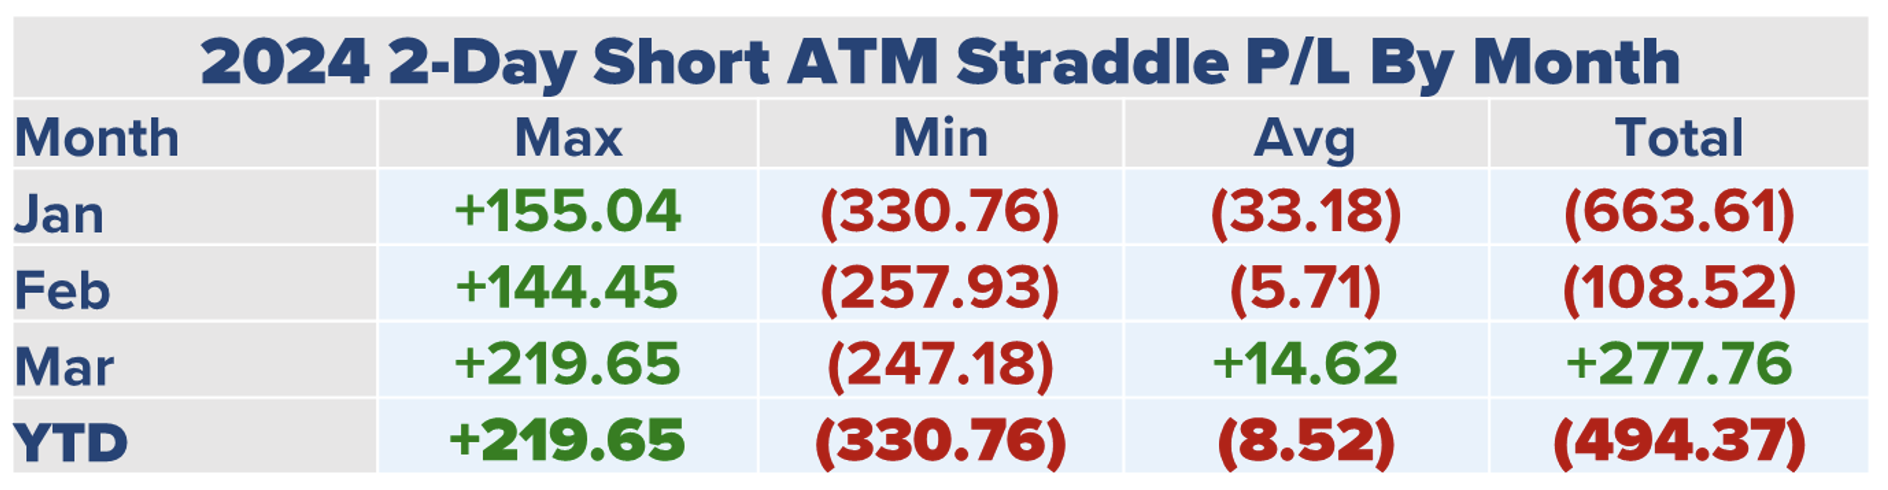
January 2024 performance was a loss of 663 points, a result that is almost twice the gains from all of 2023. February experienced a small loss and lower volatility in March resulted in a gain for 2-Day straddle sellers. There are seven instances of losses greater than 200 points for a 2-Day NDX ATM straddle seller in the first quarter 2024 which is a big contributor to the poor performance associated with selling 2-Day ATM NDX straddles.
Table 6 – Q12024 2-Day Short ATM Straddle Performance
Data Sources: Bloomberg & Author Calculations
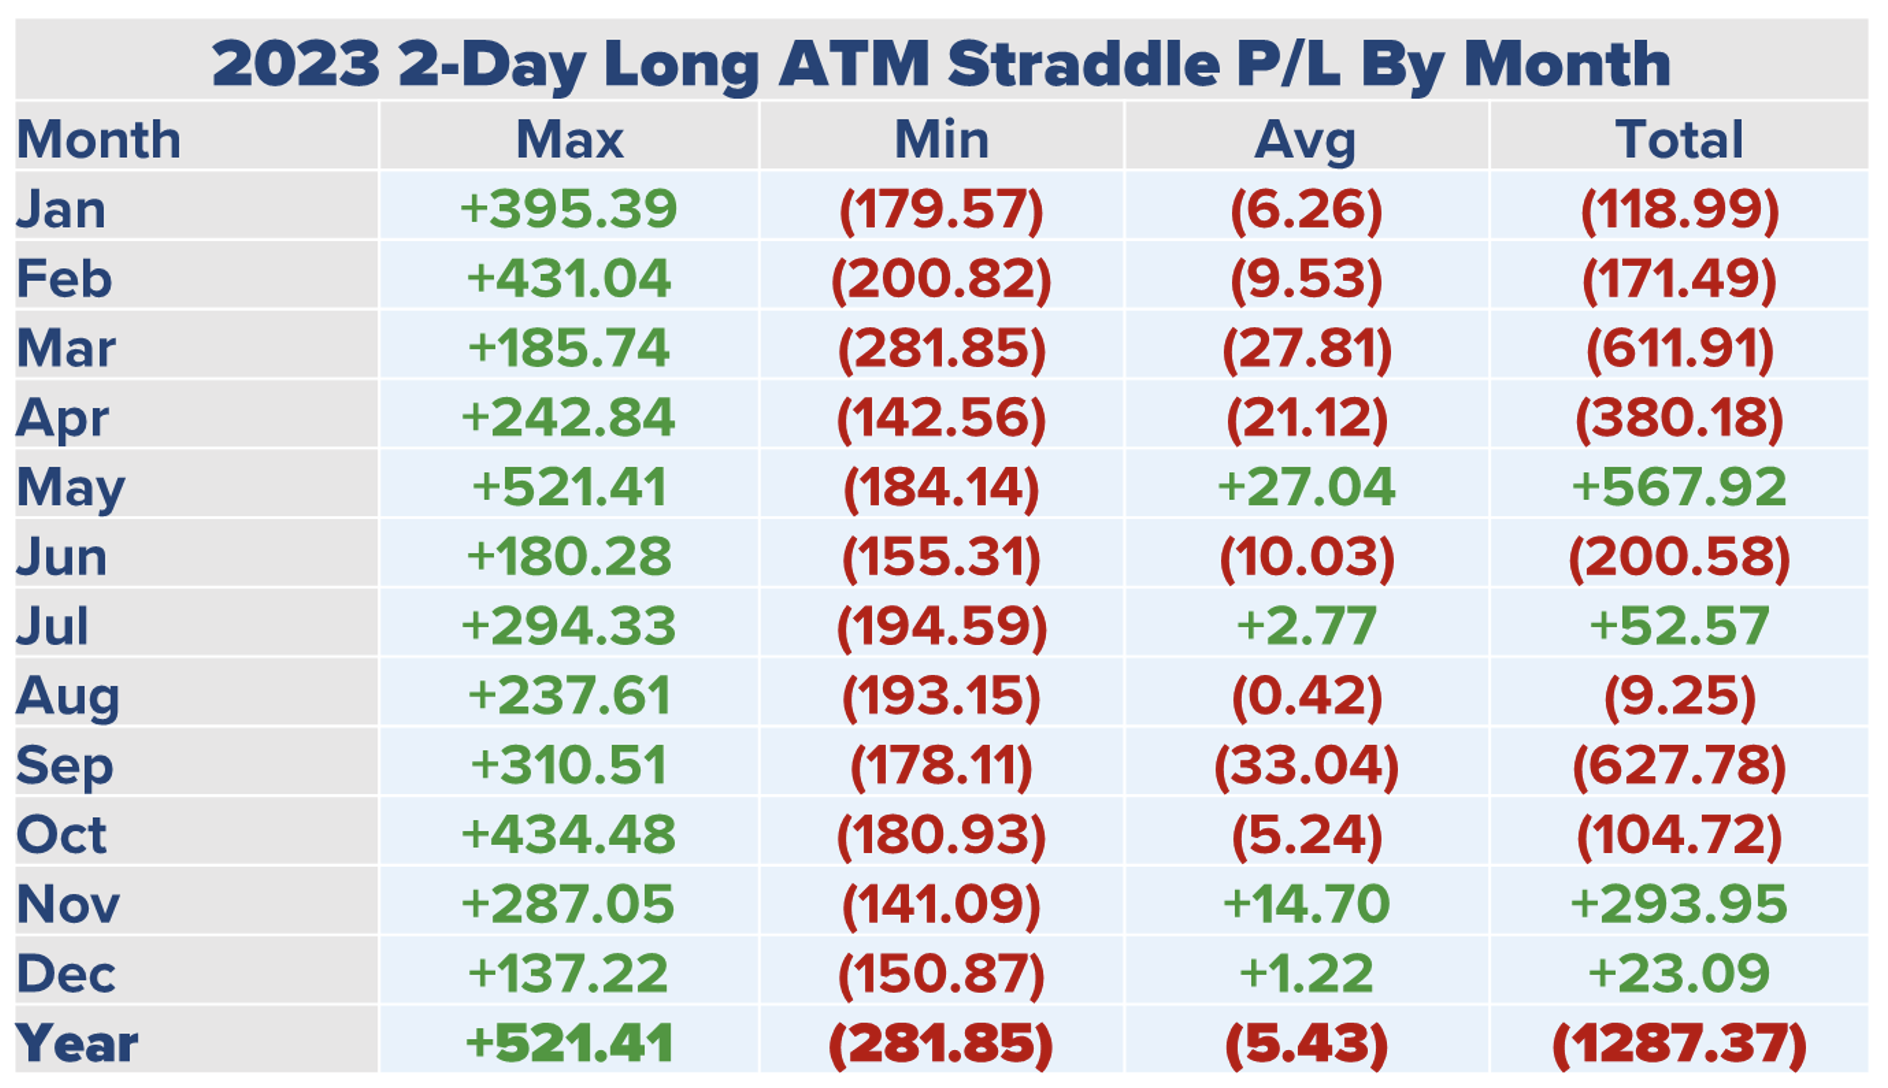
Straddle buyers in 2023 would experience losses in eight months and cumulative losses sum up to 1287 points. These losses are indicative of long straddle returns for the balance of this paper, with the longer dated strategies experiencing dramatic losses. Note on Table 7 that the two most profitable months (May and November) have total profits in line with the best day in each month.
Table 7 – 2023 2-Day Long ATM Straddle Performance
Data Sources: Bloomberg & Author Calculations
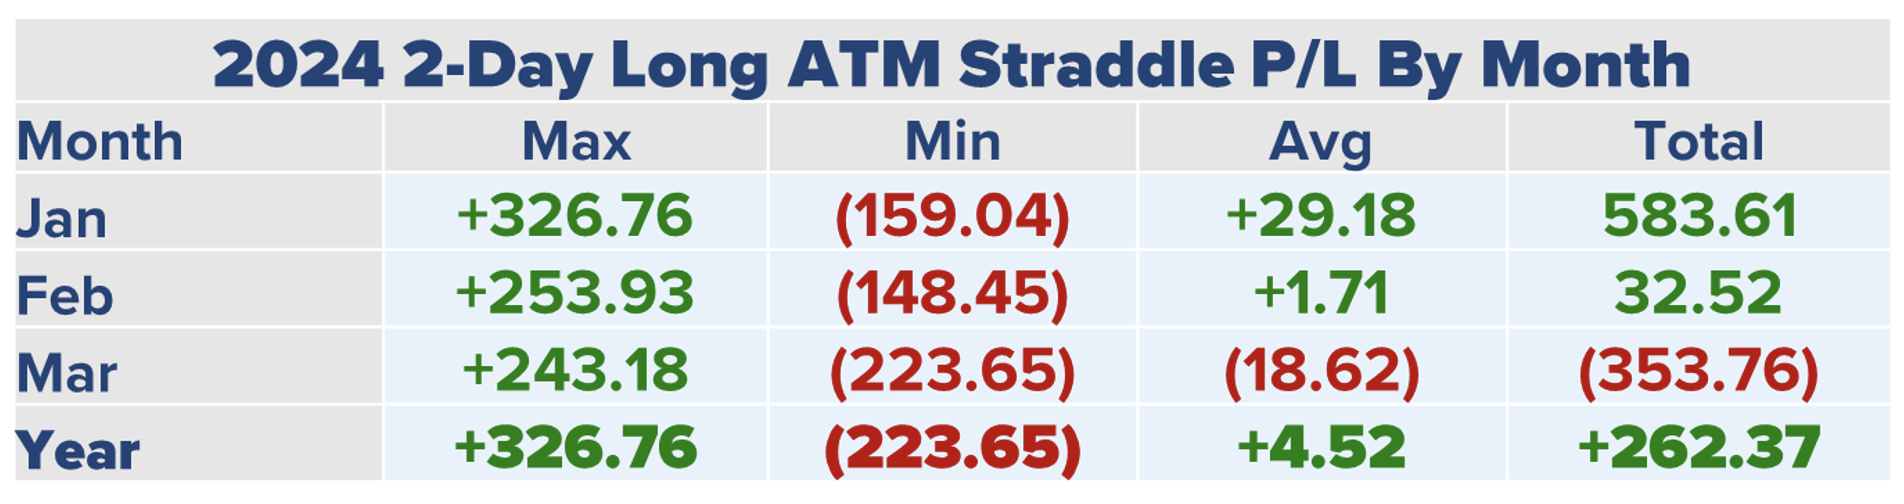
The beginning of 2024 was a good period for buyers of 2-Day straddles as January 2024 results are the best of the fifteen-month period covered in this study. The March 2024 result is the worst since September 2023 when long straddles lost 627 points.
Table 8 – Q12024 2-Day Long ATM Straddle Performance
Data Sources: Bloomberg & Author Calculations
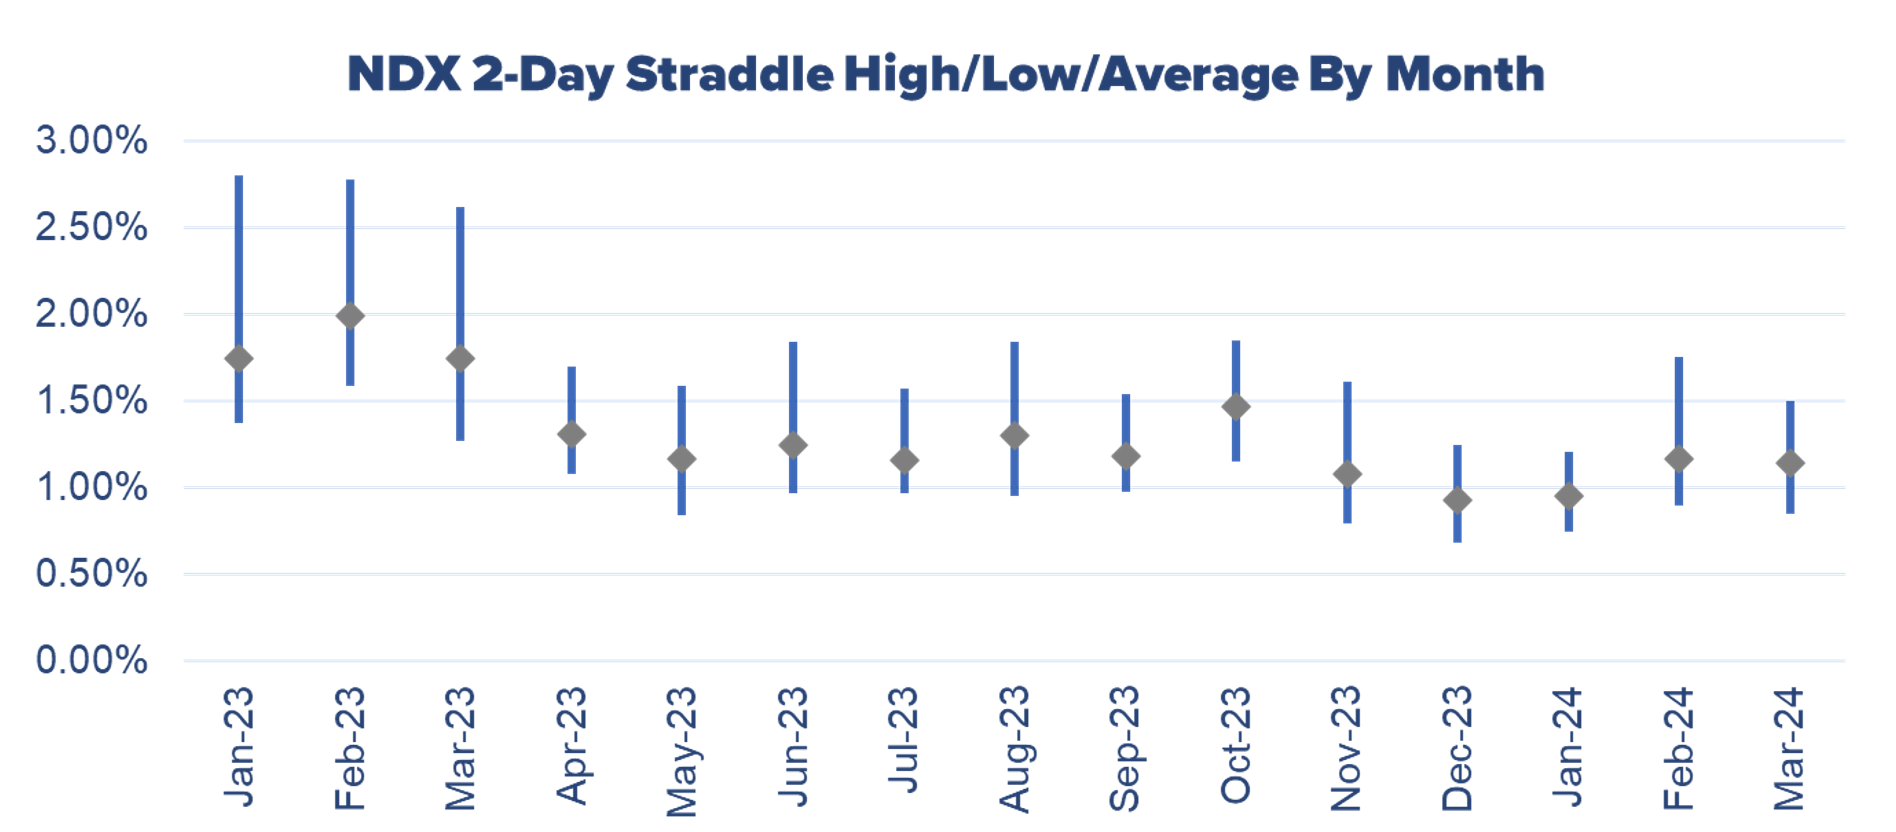
2-Day straddle pricing averaged 1.75% or higher in the first three months of 2023. Since that time, the highest average 2-Day straddle pricing occurred in October 2023 at 1.47%. Pricing moderated further in 2024 with an average straddle price of 1.08% of the index. In fact, the highest pricing in the first quarter of 2024 is 1.76%, lower than the average for the first quarter in 2023 (1.83%).
Figure 3 – 2-Day ATM Straddle Pricing By Month
Data Sources: Bloomberg & Author Calculations
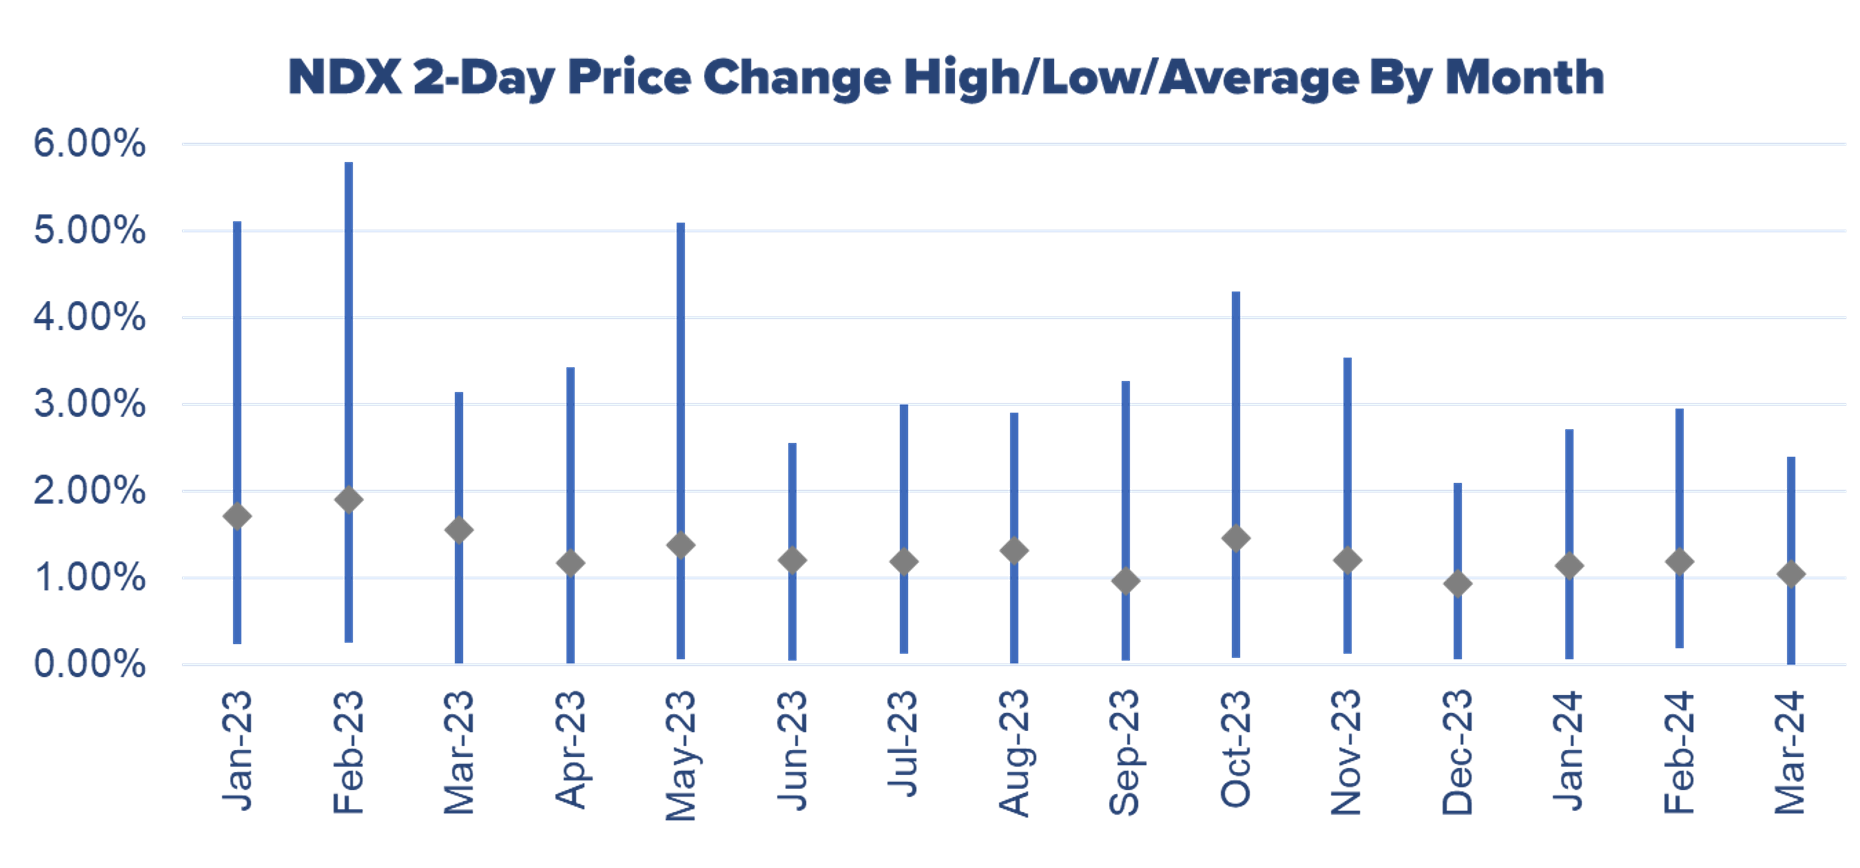
Despite the average straddle pricing at the lower end of the range, the average NDX 2-Day price change in the first quarter was 1.13%, just 20 basis points below the average price change of 1.33% for all of 2023.
Figure 4 – 2-Day Price Change Behavior By Month
Data Sources: Bloomberg & Author Calculations
3-Day Straddles
At the beginning of this paper, we noted that looking beyond the near term offered opportunities for index option traders. Table 9 is the first example of consistent profitability associated with selling ATM straddles.
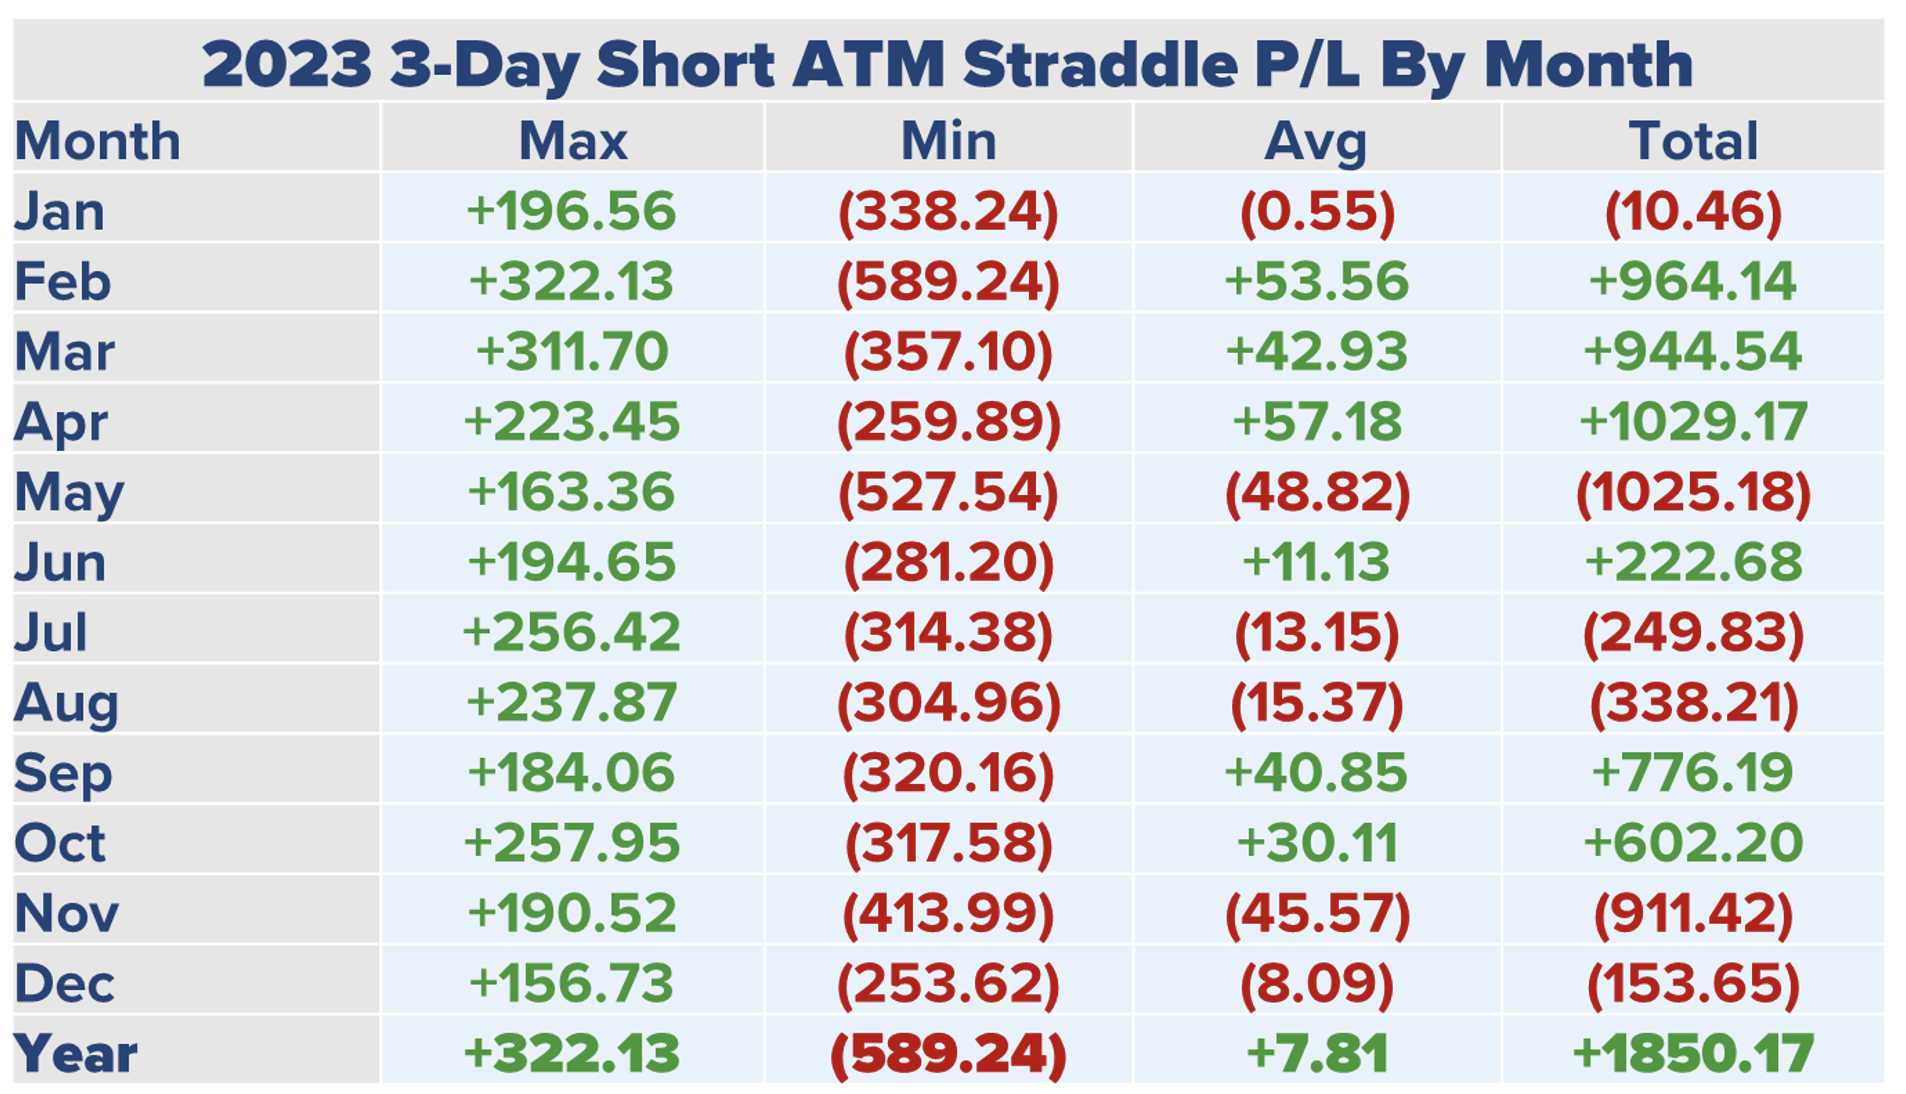
Table 9 – 2023 3-Day Short ATM Straddle Performance
Data Sources: Bloomberg & Author Calculations
The net result, based on selling a 3-Day NDX ATM straddle and holding through expiration is a gain of 1,850 points. This does not come without risk as May and November experienced significant drawdowns. The May drawdown is almost equal to the gain realized in April and comes on the heels of three strong months. November follows two profitable months as well and the November loss, at 911 points, is 467 points lower than the cumulative gain for September through October of 1,378 points.
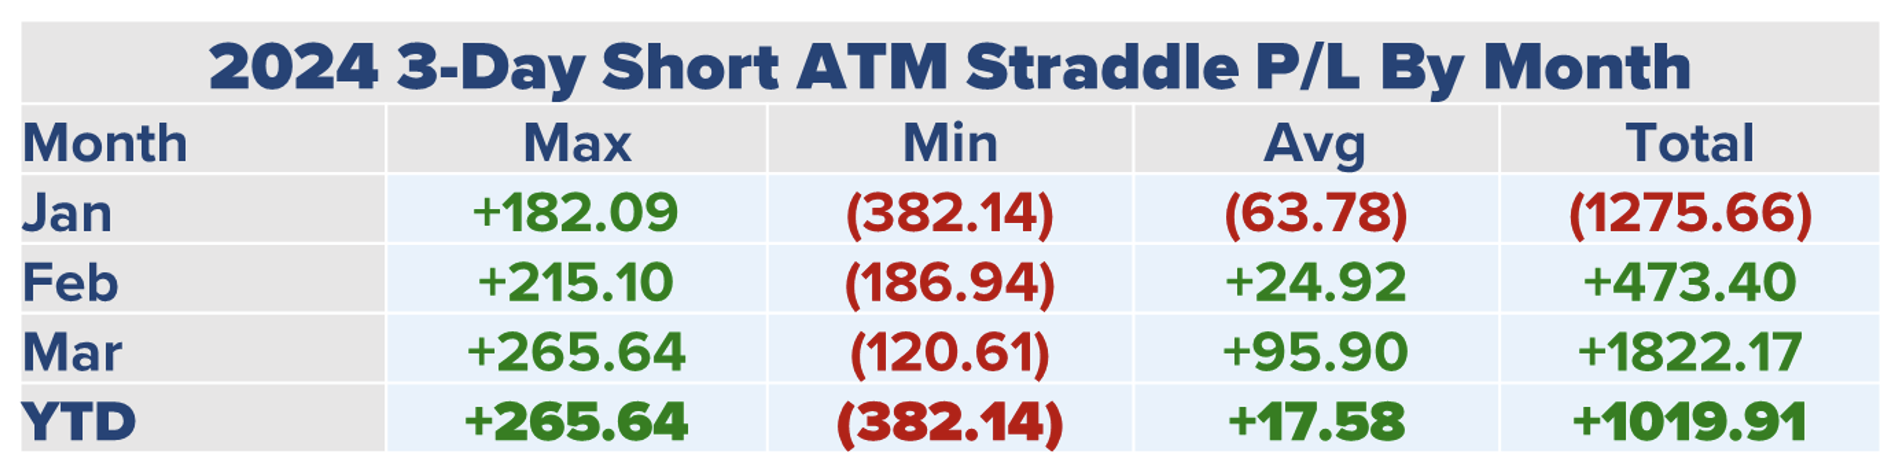
The first month of 2024 was a difficult one for 3-Day straddles sellers with a loss of 1275 points. A trader that stuck with selling volatility through the end of the quarter would have recouped those losses and then some as March 2024 is the best 3-Day straddle selling month in our lookback period.
Table 10 – Q12024 3-Day Short ATM Straddle Performance
Data Sources: Bloomberg & Author Calculations
We include the long straddle performance in Table 11, which displays poor results with only four months showing profits in 2023. Also, there are three months (February, March, and April) where a consistent 3-Day straddle buyer would lose over 1,000 points each month.
Table 11 – 2023 3-Day Long ATM Straddle Performance

Data Sources: Bloomberg & Author Calculations
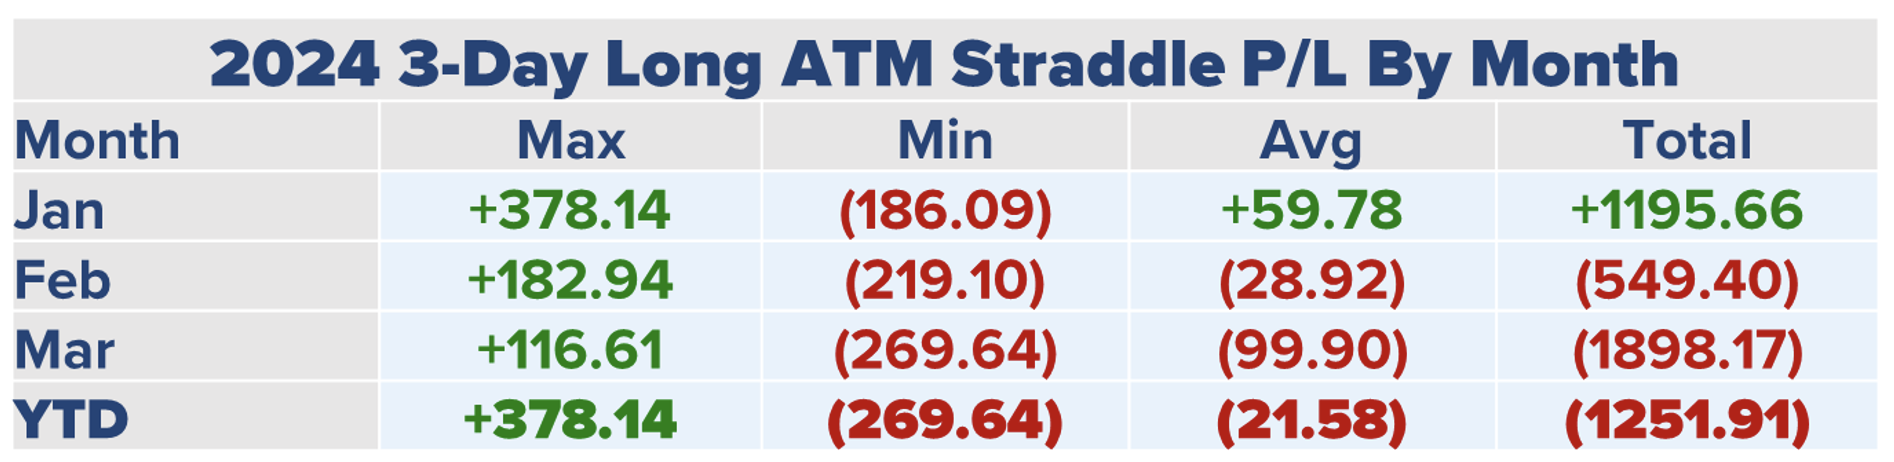
The best month for 3-Day straddle buyers appears in Table 12 as hypothetical profits in January 2024 reached almost 1,200 points. However, those gains were given up by the end of the quarter with the worst month for 3-Day straddle buyers coming in March.
Table 12 – Q12024 3-Day Long ATM Straddle Performance
Data Sources: Bloomberg & Author Calculations
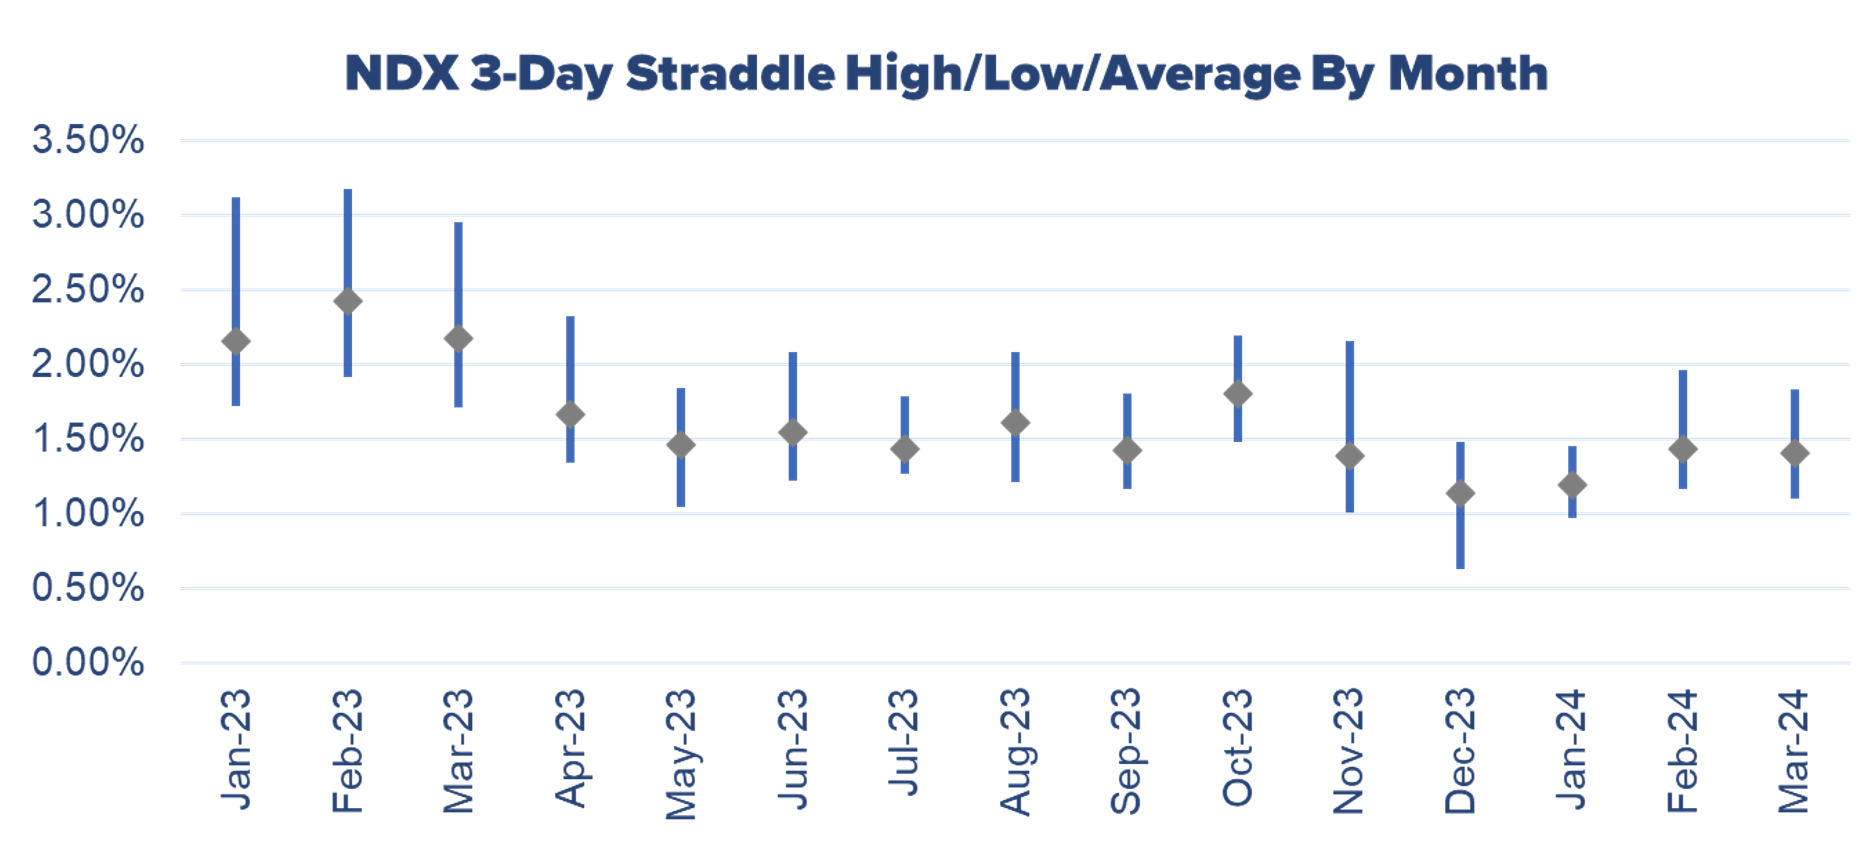
In Figure 5 we see the pricing of 3-Day ATM straddles following a similar pattern as the previous 1-Day and 2-Day examples with the first three months of 2023 pricing larger price moves than the last twelve months. In the first quarter 2023 3-Day ATM straddle pricing averaged over 2% of NDX, a level that has not been surpassed since.
Figure 5 – 3-Day ATM Straddle Pricing By Month
Data Sources: Bloomberg & Author Calculations
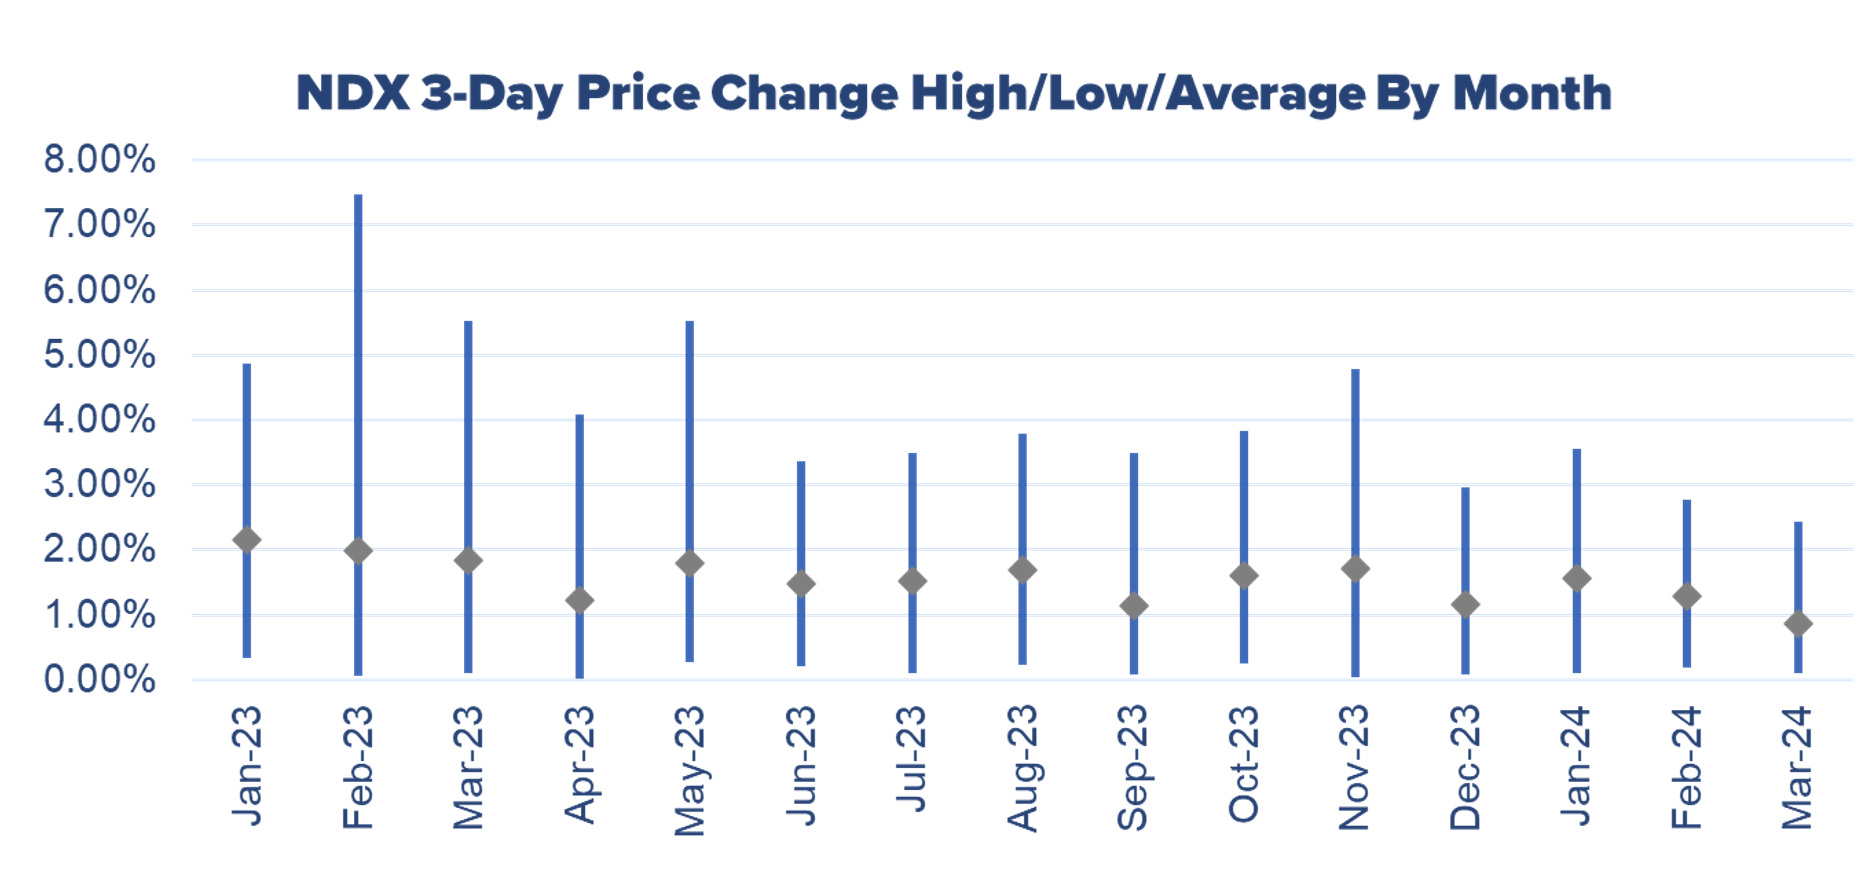
The average magnitude of NDX price changes over 3-Days appears in Figure 6. The price changes in the first three months of 2023 were higher than the following months, in line with the straddle pricing trends in Figure 5. Finally, the average price change in March 2024 was the lowest average over the 15-month lookback period at 0.87%.
Figure 6 – 3-Day Price Change Behavior By Month
Data Sources: Bloomberg & Author Calculations
4-Day Straddles
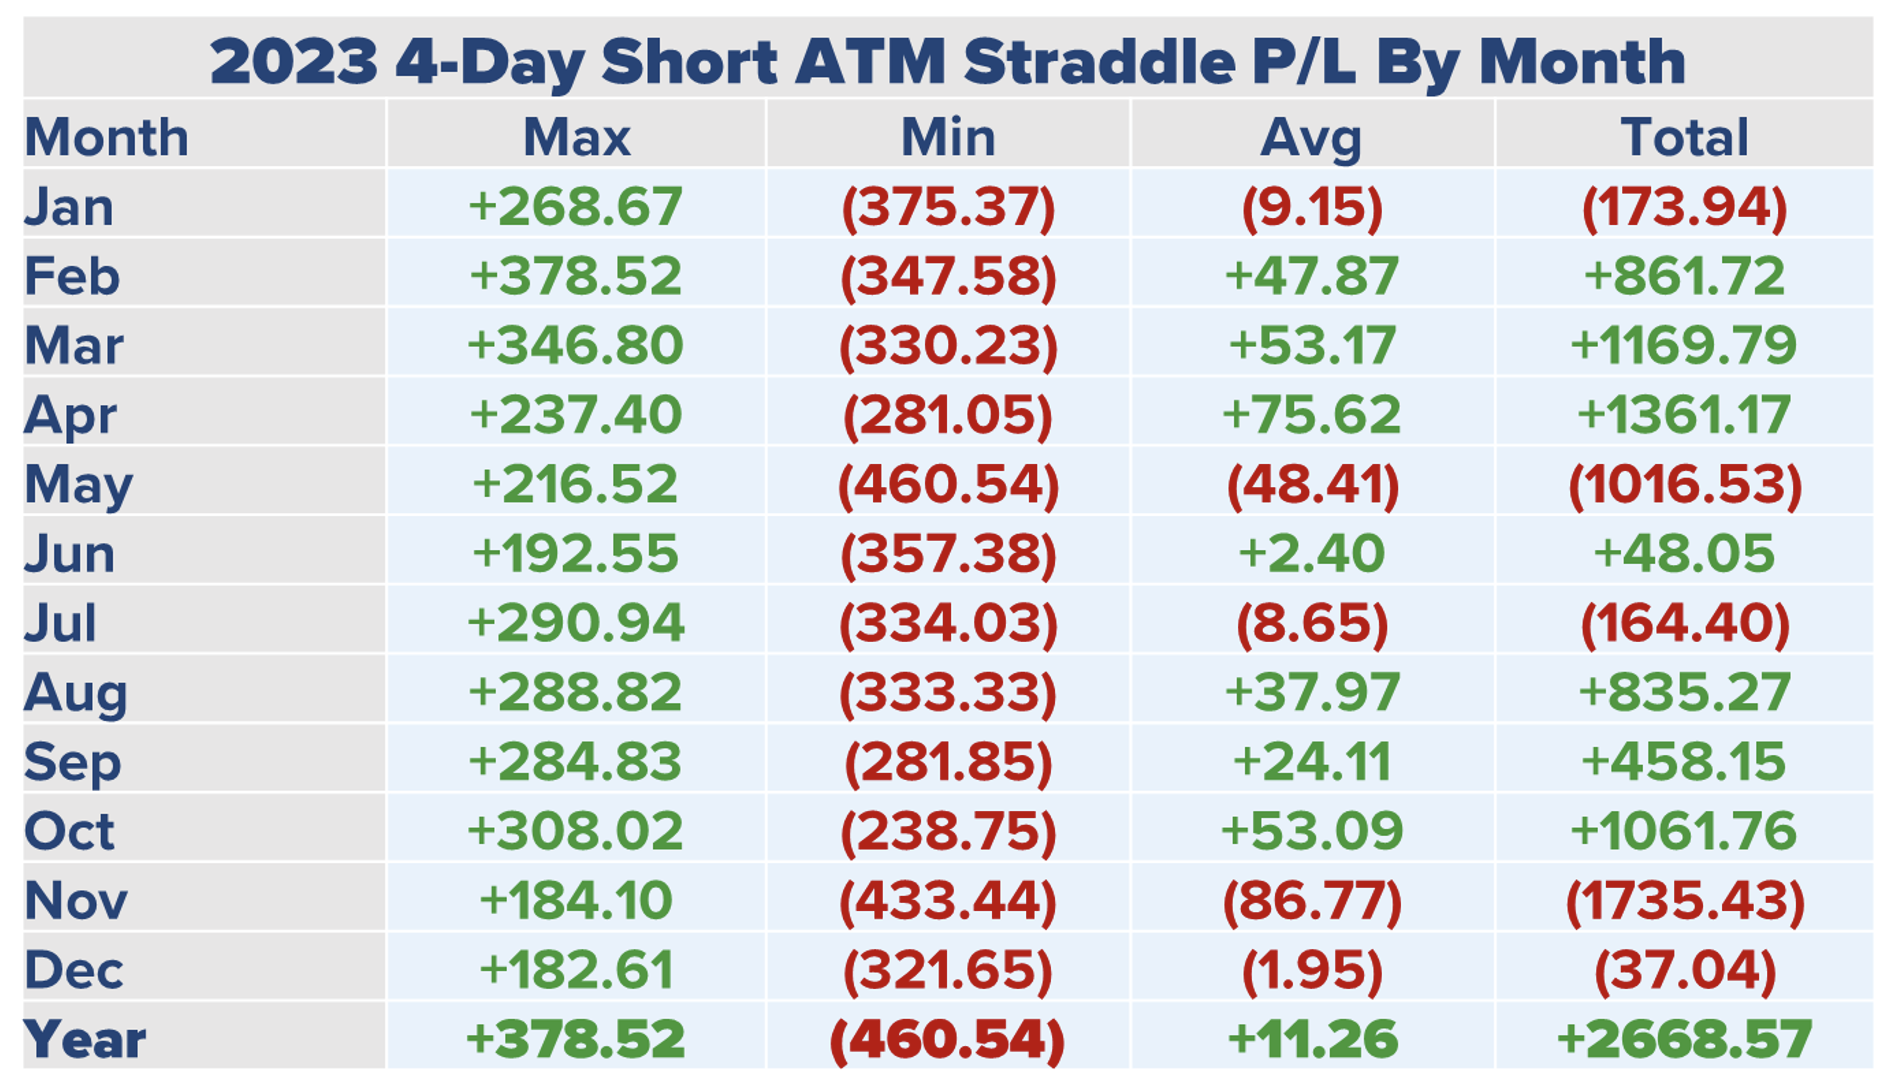
Table 13 shows the performance associated with consistently selling 4-Day ATM straddles on NDX. Of the time frames and strategies covered in this paper, shorting 4-Day straddles is the best performer. In 2023 this approach would result in over 2,668 points in profits. Of course, there were some drawdowns in 2023, with November losses exceeding 1,735 points and another 1,000-point loss in May.
Table 13 – 2023 4-Day Short ATM Straddle Performance
Data Sources: Bloomberg & Author Calculations
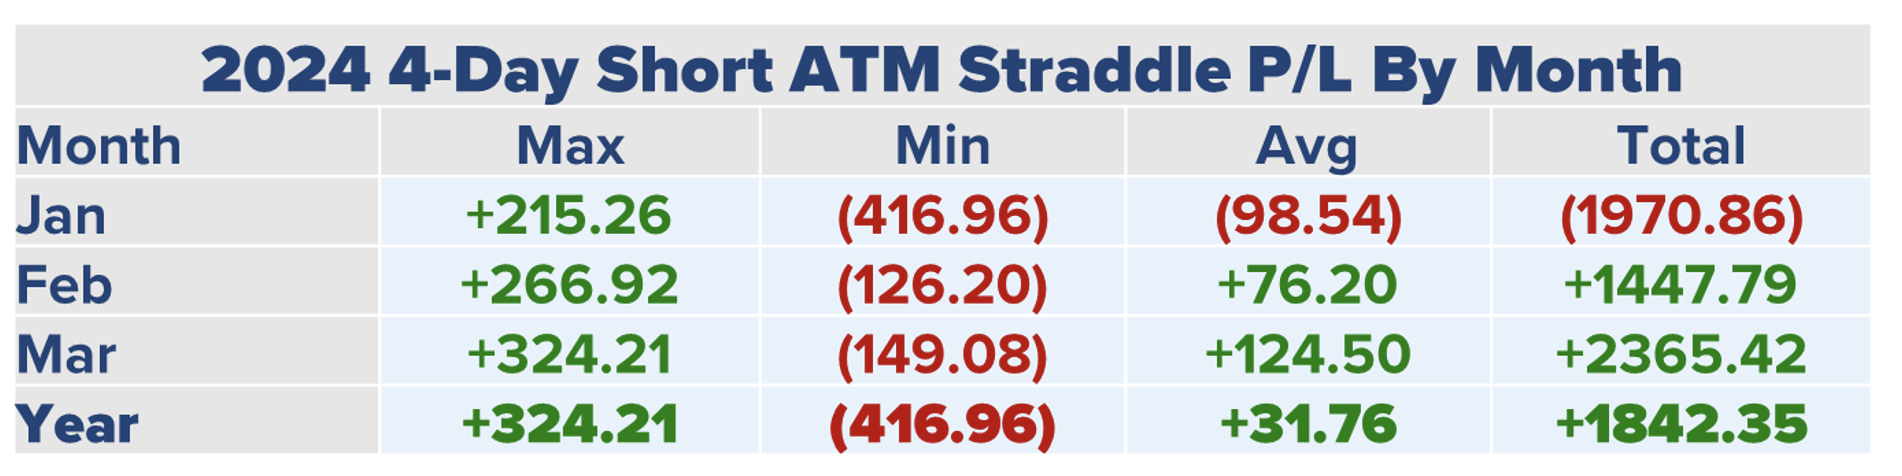
The 4-Day short approach began 2024 with the worst month in our 15-month history, losing 1,970 points. However, performance quickly rebounded and for the quarter the result was a gain of 1,842 points.
Table 14 – Q12024 4-Day Short ATM Straddle Performance
Data Sources: Bloomberg & Author Calculations
Of course, if the short approach is very profitable, then the long approach would be extremely unprofitable. That is the case in Table 15 where performance for a consistent long 4-Day ATM straddle over the course of 2023 is displayed.
Table 15 – 2023 4-Day Long ATM Straddle Performance
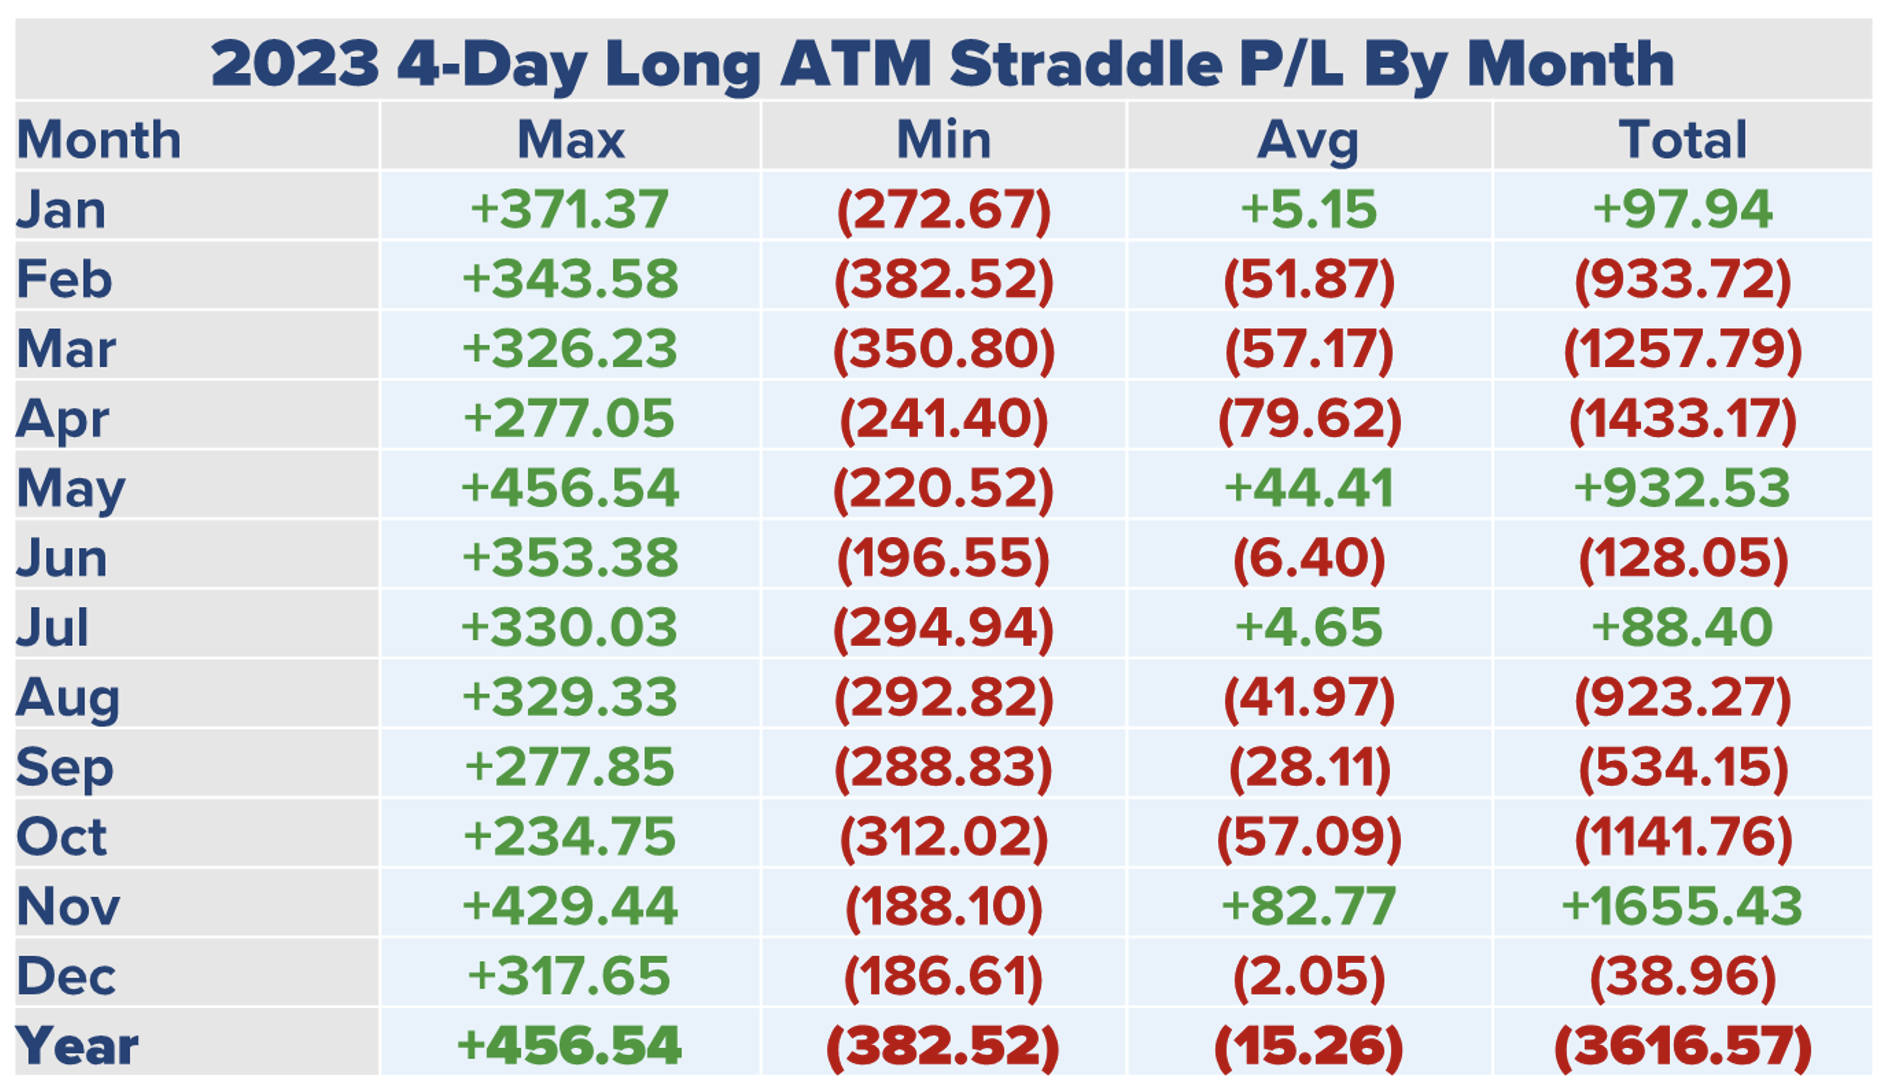
Data Sources: Bloomberg & Author Calculations
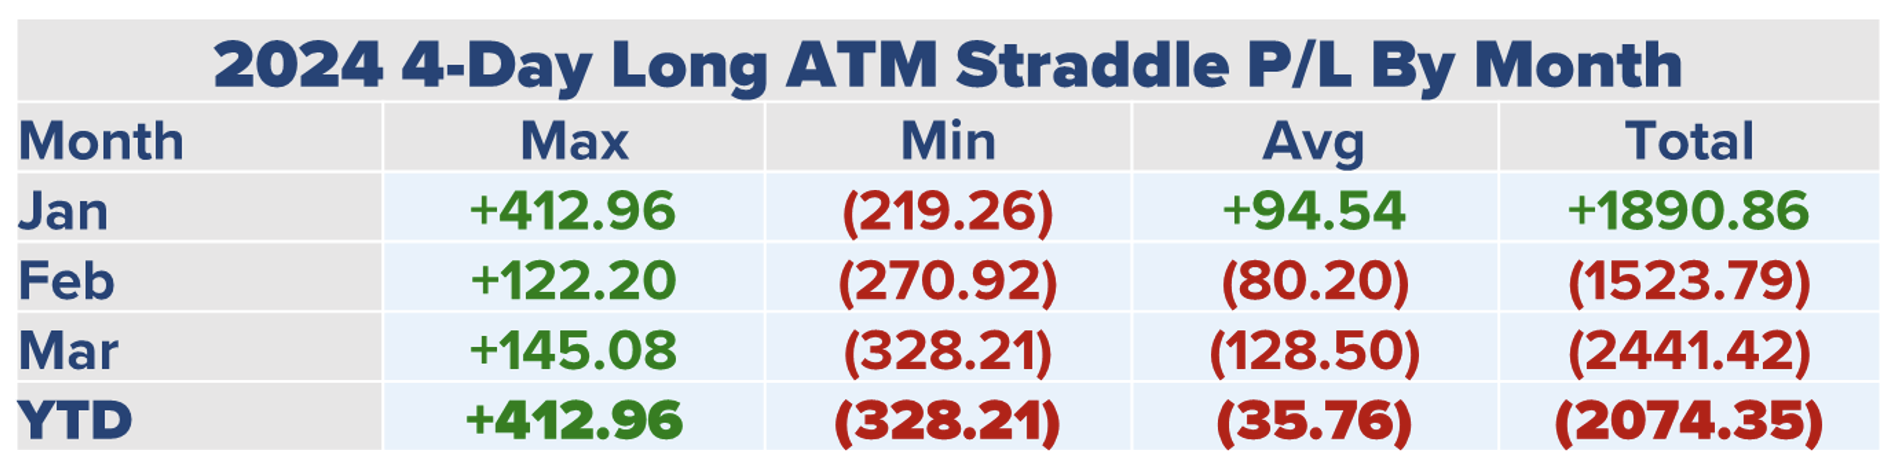
Over the course of 2023, this strategy loses over 3,600 points including five months where the losses exceed 900 points. The best month for a 4-Day straddle buyer was January 2024, with a gain of 1890 points. Despite that positive start to this year, this approach was a big loser in February and March placing the year-to-date 2024 return at a loss of 2,074 points.
Table 16 – Q12024 4-Day Long ATM Straddle Performance
Data Sources: Bloomberg & Author Calculations
Note on Figure 7, the lowest average premiums for 4-Day straddles occurred in December 2023, a month where both the long and short approaches were losers. The losses for both these approaches were almost equal to the amount of slippage (2.00 per trade x 19 Trading Days) of 38.00 points.
Figure 7 – 4-Day ATM Straddle Pricing By Month
Data Sources: Bloomberg & Author Calculations
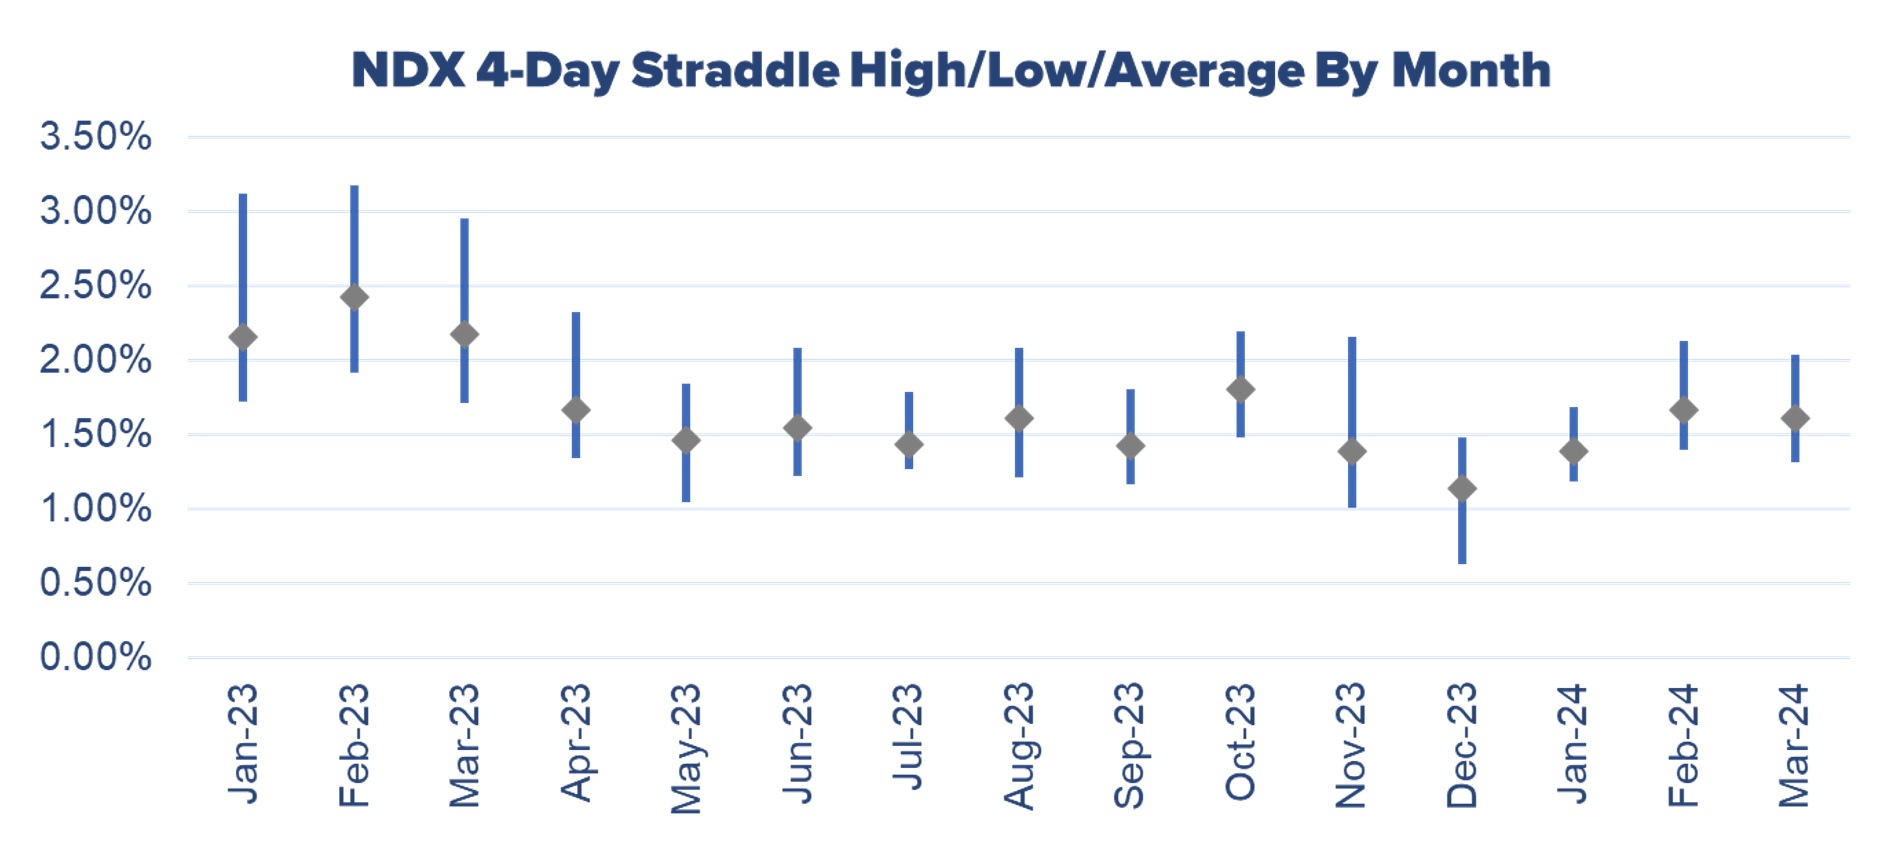
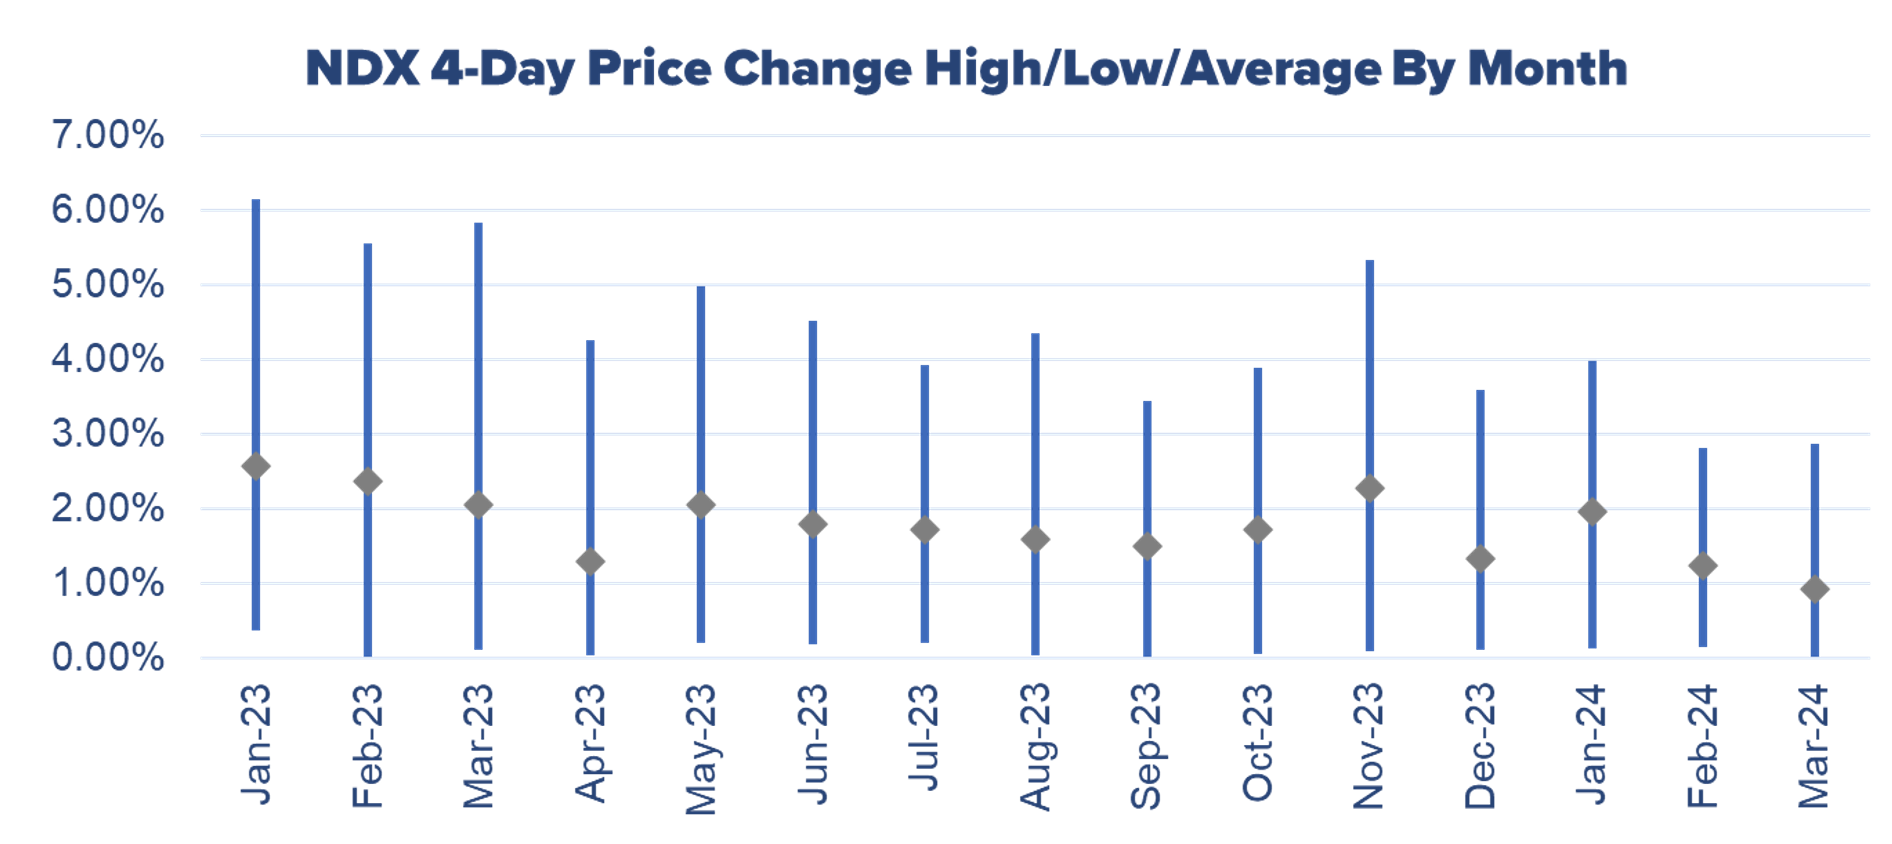
A final look at 4-Day NDX price action appears in Figure 8 where the average price move by month is displayed. The trend over the last 3 months of the chart (January – March 2024) is interesting as straddle sellers were losers in January, but winners in February and March, with lower average price changes indicated for those two months versus January.
Figure 8 – 4-Day Price Change Behavior By Month
Data Sources: Bloomberg & Author Calculations
5-Day Straddles
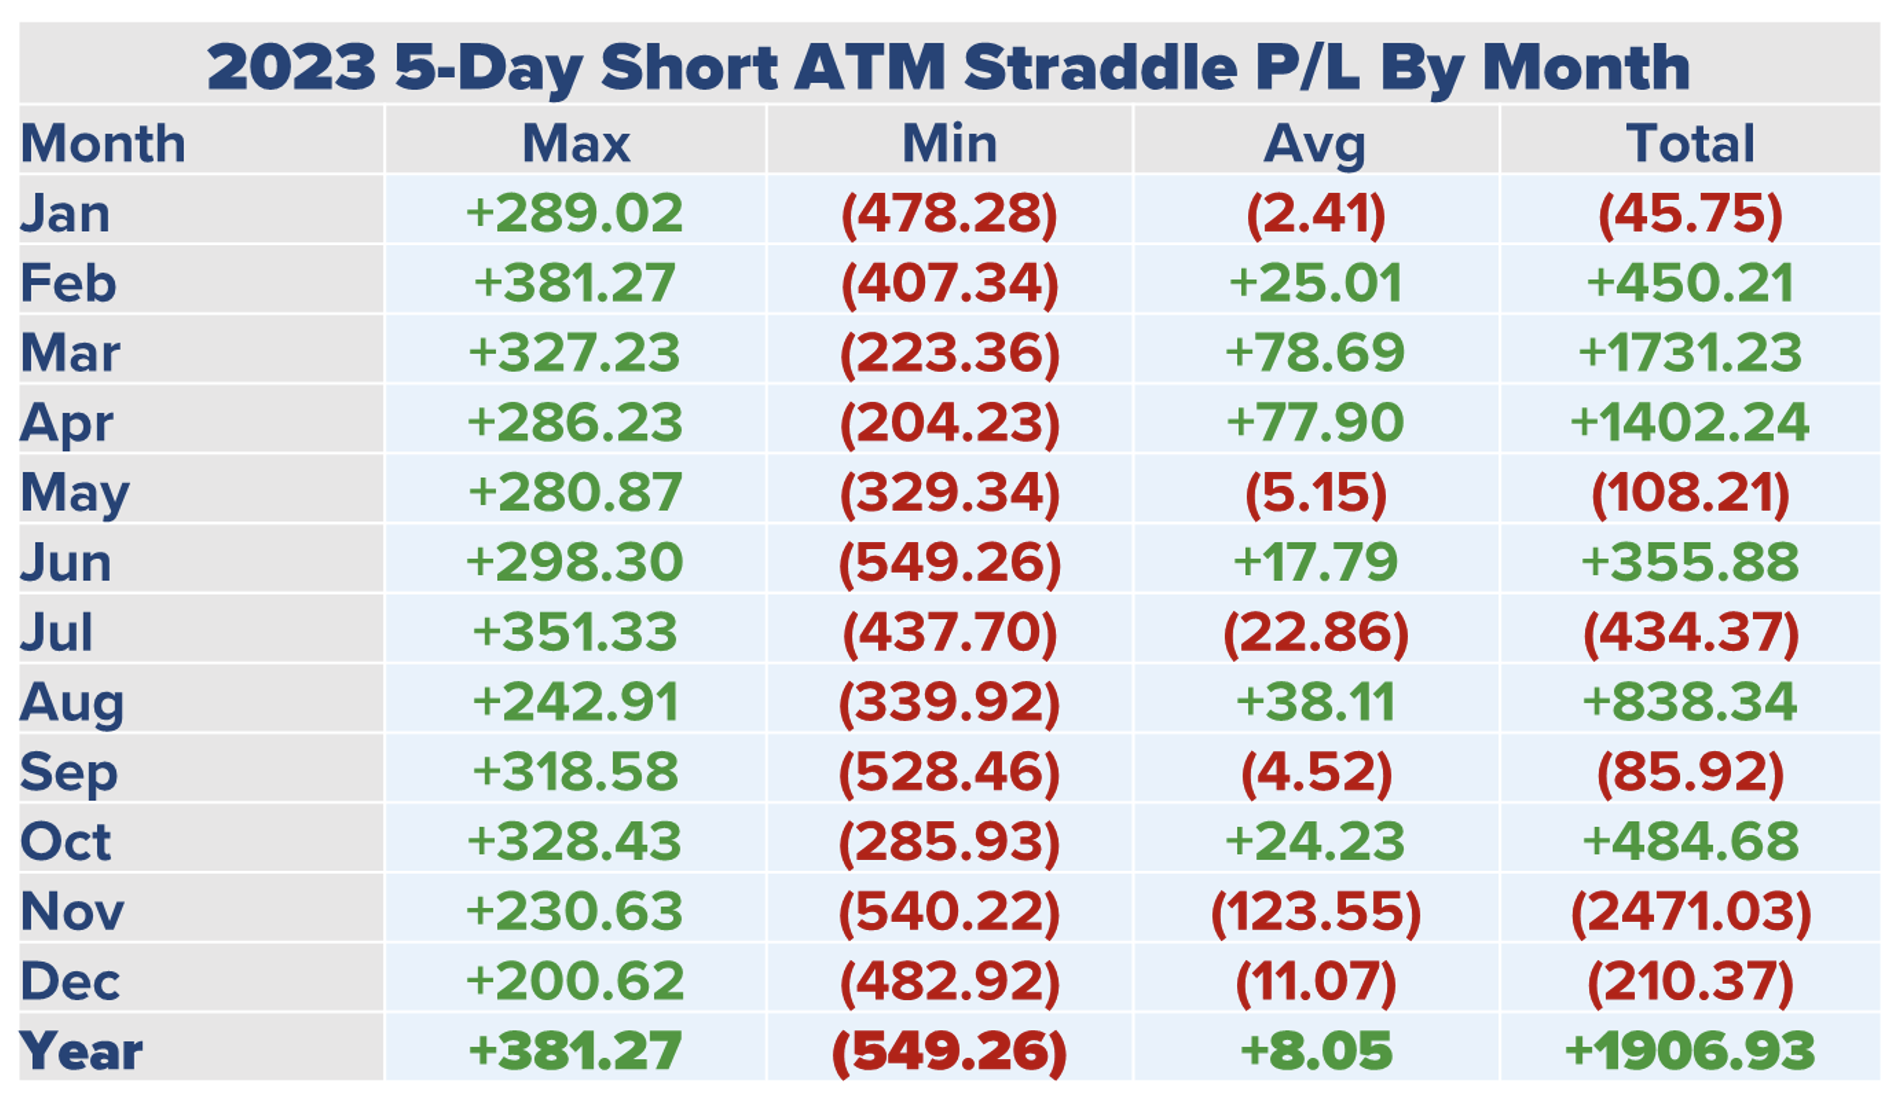
Consistently selling 5-Day ATM straddles in 2023 was an approach that was successful, however, not as successful as using 4-Day straddles. For the year, this approach gains 1,906 points. The differentiating factor is November 2023, where this approach lost 2,471 points, versus a loss of 1,735 in November 2023 when shorting 4-Day straddles.
Table 17 – 2023 5-Day Short ATM Straddle Performance
Data Sources: Bloomberg & Author Calculations
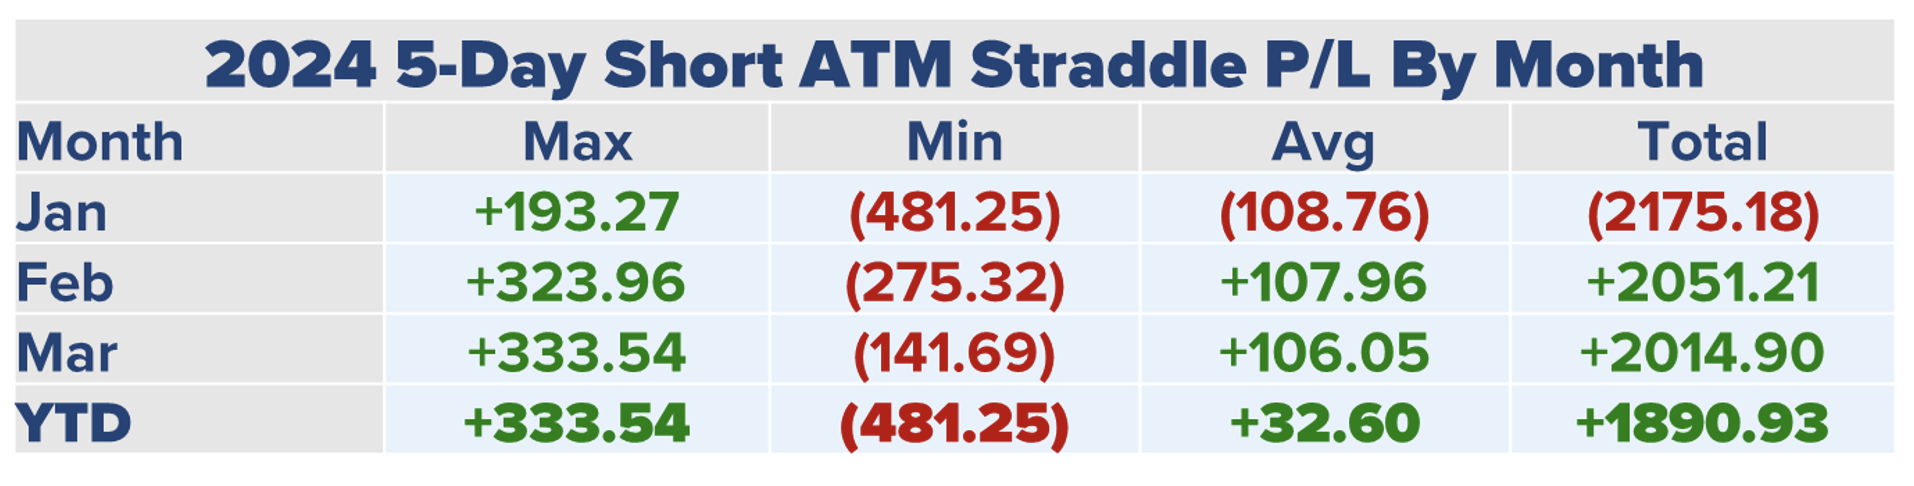
January 2024 was a tough month for 5-Day straddle sellers, with a loss of 2175, but this was quickly made up for with over a 2,000 point gain in both February and March 2024. Those two strong months have this approach up 1,890 points for 2024.
Table 18 – Q12024 5-Day Short ATM Straddle Performance
Data Sources: Bloomberg & Author Calculations
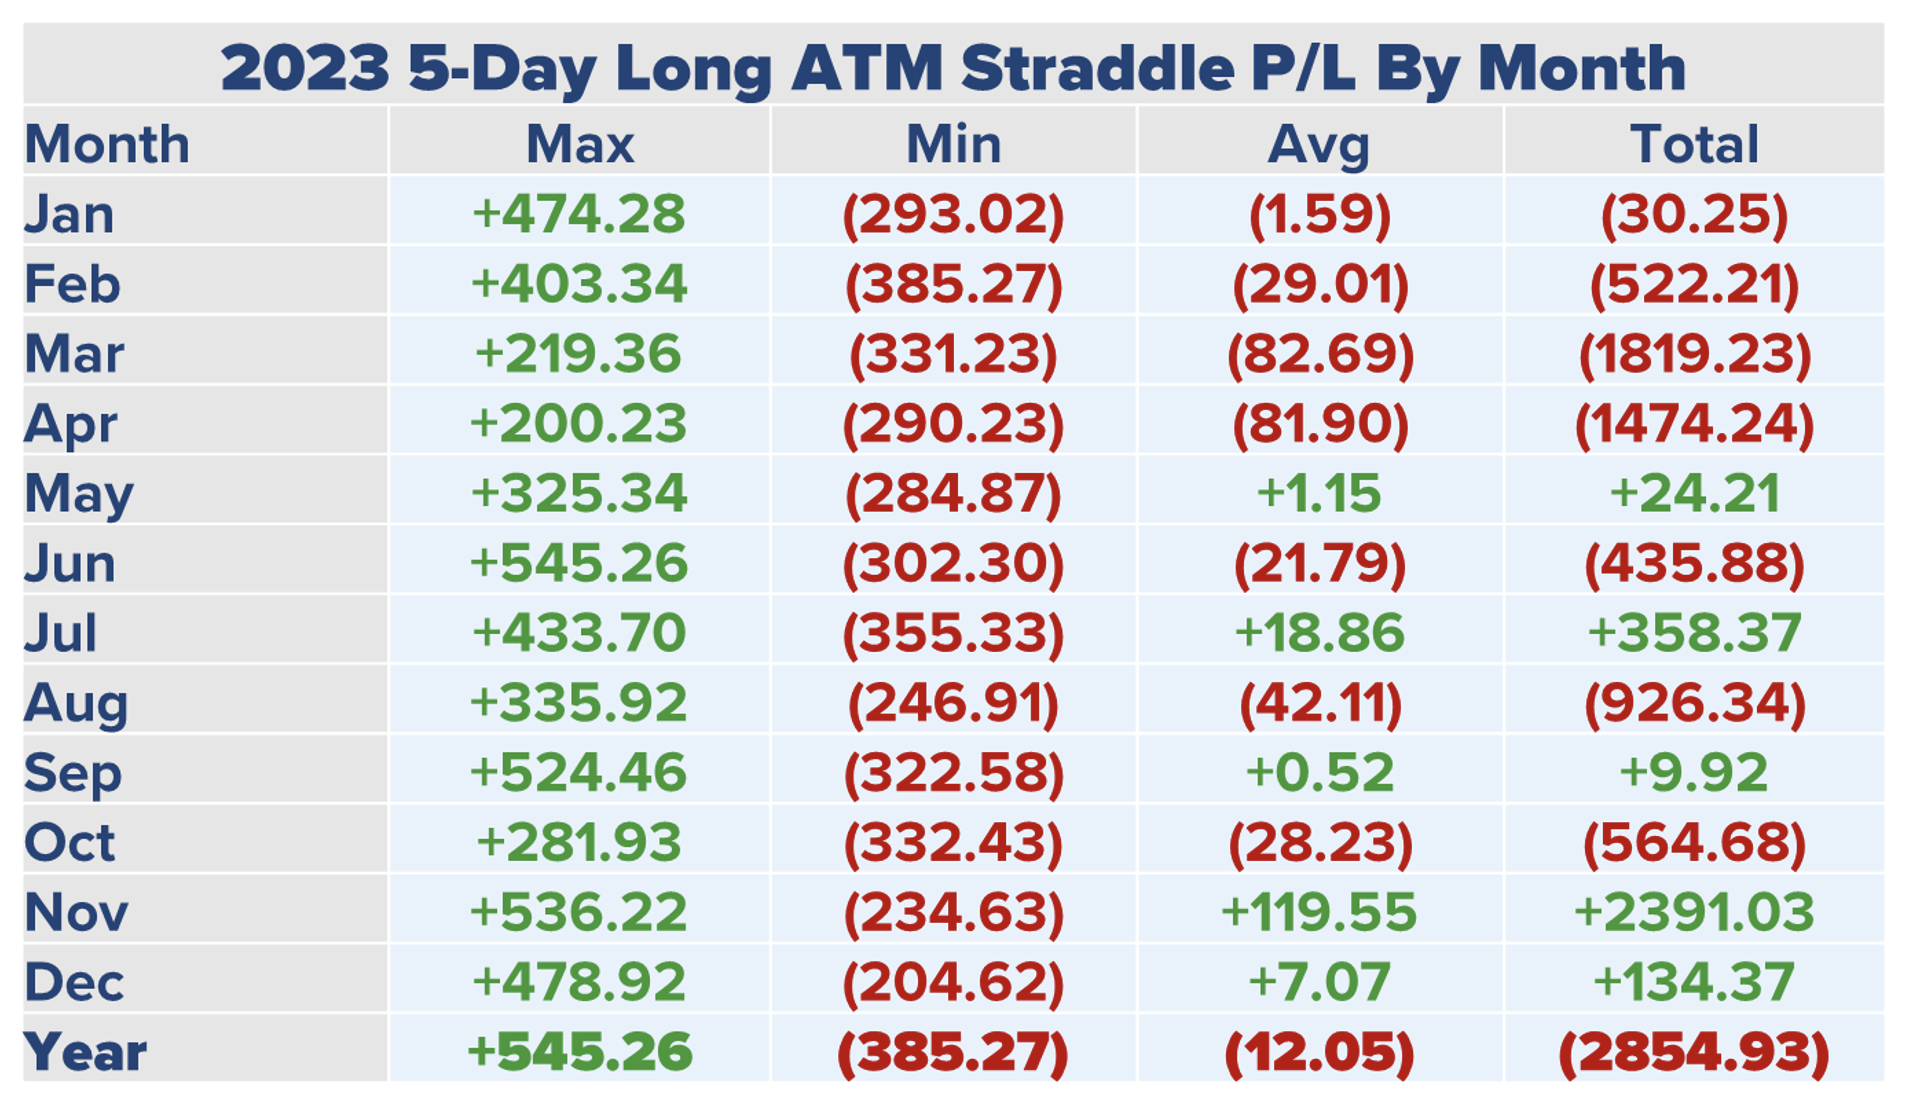
Long 5-Day ATM straddles performed very poorly, as would be expected when considering the short performance in the two previous tables. In 2023, a long approach loses 2,854 points, with only one good month over the course of the year. That month, November, had gains of 2,391 points.
Table 19 – 2023 5-Day Long ATM Straddle Performance
Data Sources: Bloomberg & Author Calculations
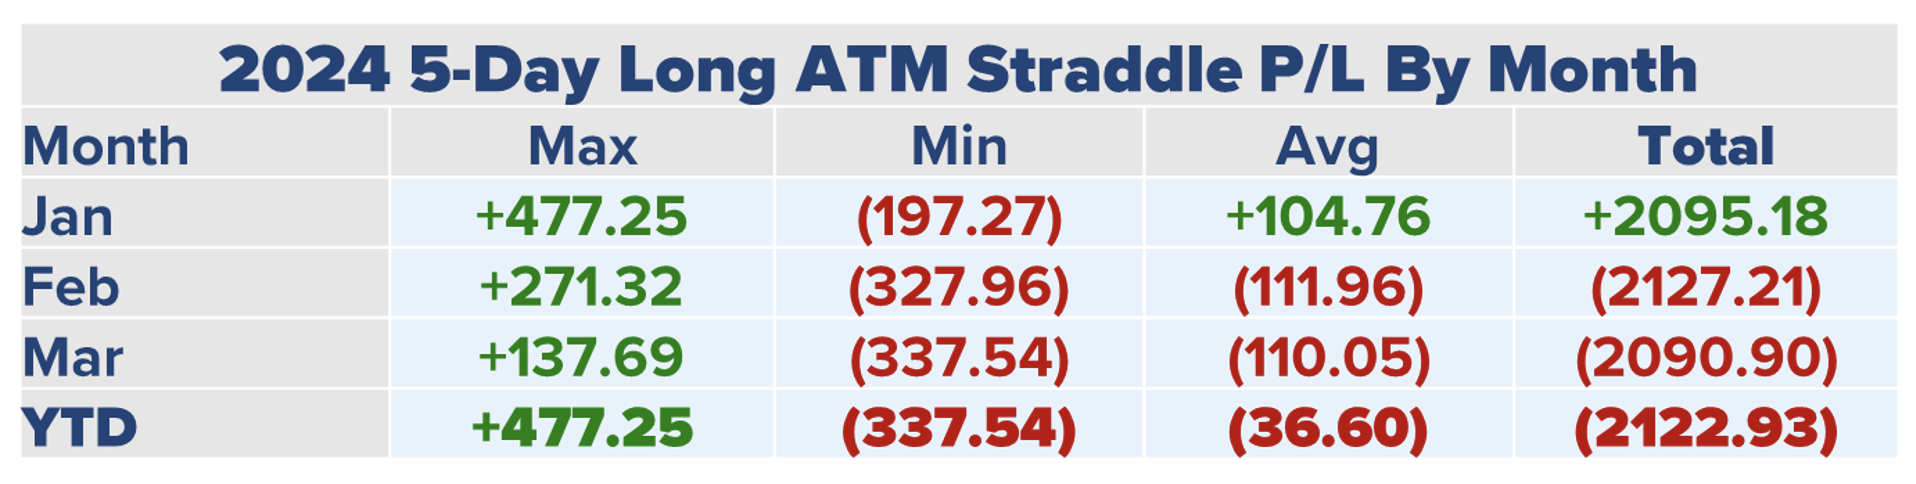
Finally, Table 20 displays long 5-Day straddle performance. January 2024 was a good month, but not the best month for buying 5-Day straddles. Despite a strong start to 2024, February and March results were the two worst over the past fifteen months, pushing losses to 2,122 points for 2024.
Table 20 – Q12024 5-Day Long ATM Straddle Performance
Data Sources: Bloomberg & Author Calculations
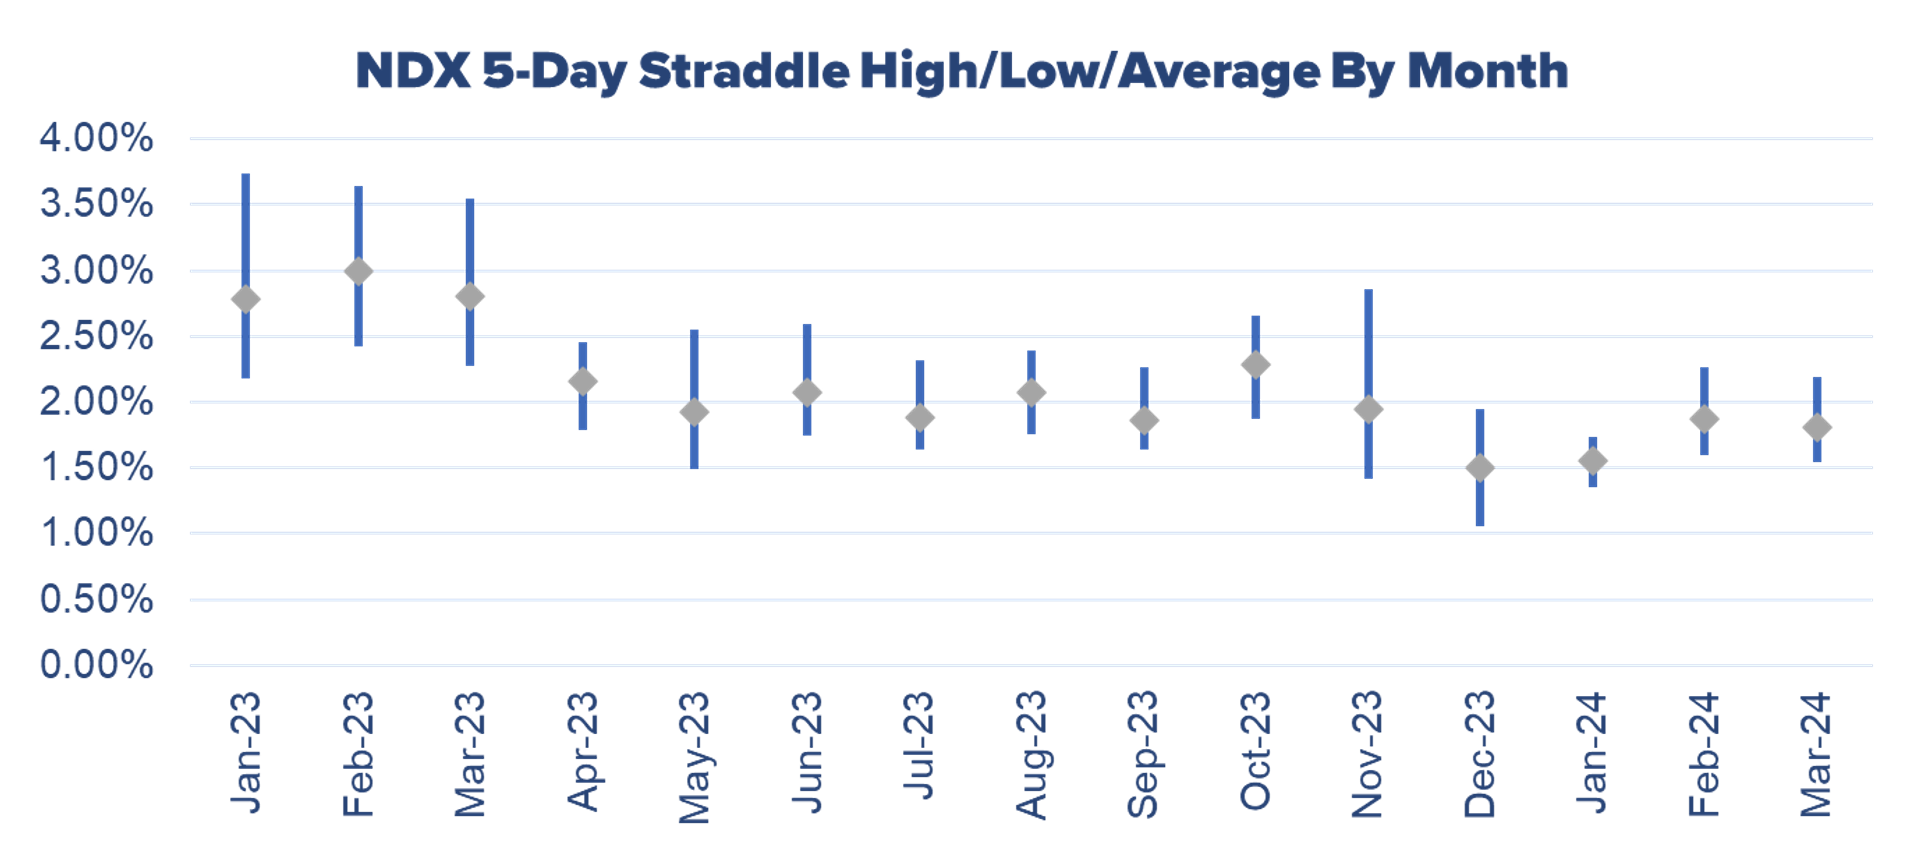
The average 5-Day straddle pricing peaks at 3.00% in February 2023 before moving lower and hovering around the 2.00% range for the balance of 2023. In 2024, the average was only 1.56% for January 2024, a major contributor to the good month for straddle buyers.
Figure 9 – 5-Day ATM Straddle Pricing By Month
Data Sources: Bloomberg & Author Calculations
5-Day price changes were near 3.00% in January and February of 2023 before reverting to the 2.00% range. Note, November 2023’s average price change of 2.81% coincides with another good month buying 5-Day straddles.
Figure 10 – 5-Day Price Change Behavior By Month
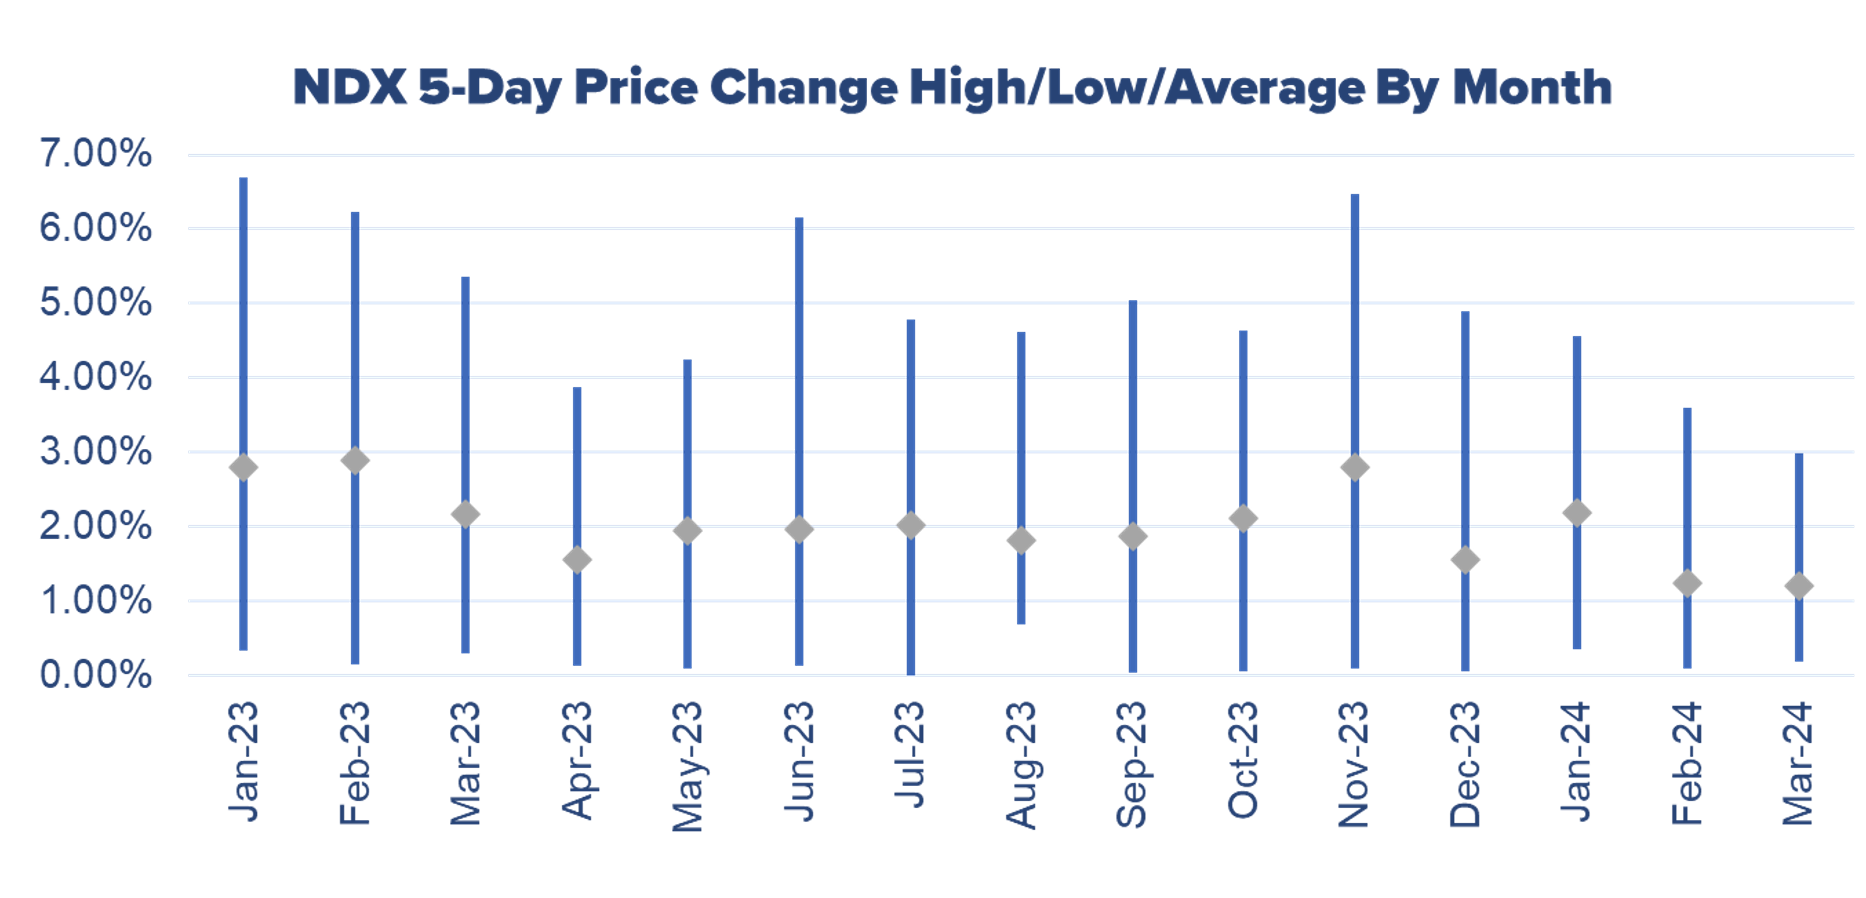
Data Sources: Bloomberg & Author Calculations
Conclusions
First, before moving forward, past performance does not guarantee future results. We have 15 months of data to work with and market conditions may change over time, including NDX option pricing. Also, selling straddles is not an appropriate trade for many traders, but this information may be applied to other neutral strategies like iron butterflies and iron condors.
NDX option pricing when there is one or two days remaining to expiration is mixed with consistent long positions and short positions having periods of profitability. The longer dated straddles, specifically spanning four or five days have been profitable for short sellers, but with a few dramatic drawdowns.
The views and opinions expressed herein are the views and opinions of the author and do not necessarily reflect those of Nasdaq, Inc.
In This Story
NDX
Russell Rhoads, PhD, CFA
Russell Rhoads, Phd, CFA is a highly regarded strategist, educator, and consultant – among other things he is perhaps best known as the author of Trading VIX Derivatives, the textbook in the space.
Read Russell Rhoads' Bio