

Please find Running Oak's most recent performance and letter below. Our strategy is an excellent complement to the most popular, high-flying holdings: S&P 500, QQQ, Mag7, unprofitable/innovative Tech, etc. It can be a thankless job, but we welcome the opportunity to be your clients' portfolio designated driver.
Personal note: My car will go 160mph. I drive 74 in a 65. I do so, because - while driving 160 will get me where I want to go much faster - it'll likely end in a fiery disaster. It also more reliably gets me where I need to go by lowering the risk of death and spending time with police, going nowhere on the side of a highway.
The goal of Efficient Growth is to provide the highest possible risk-adjusted return WITHOUT taking our clients off the cliff, dashing their financial dreams. The forward PE of the top 10 holdings in the S&P 500 is now 38, 53% HIGHER than the peak of the Tech Bubble. Mean reversion - simply back to the peak of the Tech Bubble - is the cliff, a 35% decline. Mean reversion back to 20, a premium over history, is a 48% decline.
The last six months have been the craziest I have ever experienced and, arguably, the craziest in history. Common sense, self-evident qualities we intentionally invest in for clients (companies making money, attractive valuations, responsible use of debt, lower volatility/risk) have performed the worst, while qualities we intentionally help our clients avoid (companies losing money, historically high valuations, borderline bankruptcies, memes, high volatility/risk) have performed the best. Because we invest in companies that make money, we have lagged.
Yesterday, I had a realization: were I to describe our underperformance over the last 6 months in one word, it would be GOOD. It is GOOD that we haven't kept up with unprofitable, overvalued, high-risk memes when they have performed better than any time in history. It is GOOD that we have performed in line with profitable, attractively valued, lower risk companies. Had we not, we would be liars, driving 160mph, and our clients should fire us. We wouldn't be doing what we have always said we would, not hurtling them toward the cliff. Nothing matters more in this industry - let alone when being entrusted with the financial well-being of others - than TRUST. Trust is built upon integrity and discipline. We haven't stepped on the gas to keep up with the S&Pses - buying that which many are piling into, and we never will. In fact, our process has done the opposite. That is the purpose of our unemotional, discipled, rules-based process: to take us where the profit AND value lie.
I believe this moment is uncomfortably similar to the periods our strategy has provided the greatest value for clients over the last 36 years. My hope is to help as many as possible navigate whatever is to come and safeguard their financial dreams.
Trick or Treat? - A critical dynamic to consider (that apparently no one else is)

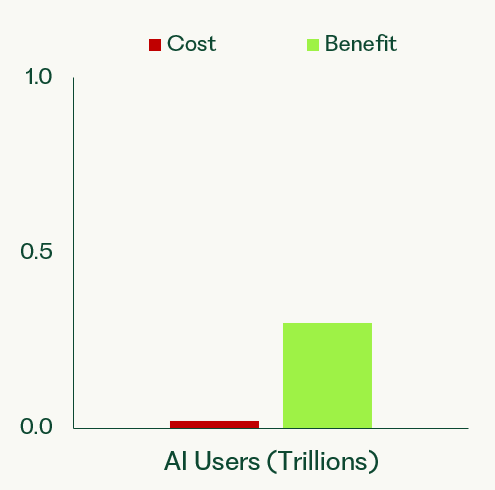

Notice the green bar in the top chart is identical to the red bar in the second chart. That is because the revenue of the largest native AI companies (OpenAI, Anthropic, and others) has a reciprocal cost, that which their customers are paying. That revenue was recently estimated to be around $18.5B, annualized. AI can improve just about everything. The customers of these AI companies are paying $18.5B to build more profitable companies (and maybe a few employees are creating funny pictures). Numbers are all over the place, but the global AI market is expected to be between 200 to $600B in 2025. The backbone of that potential is AI capital expenditure. (I am conservatively ignoring the massive cost of compute at the moment.) Gartner states AI capex could be as high as $1.5 Trillion this year. We’ll play it conservatively and go with $1T.
Simple P&L Example:

AI Companies’ Pain => AI Users’ Gain
Native AI users are receiving a significant benefit at the cost of AI-related companies and, in particular, AI infrastructure/capex investors.
It was all a dream. I used to read Word Up! Magazine. Would you rather have the top income stream or the bottom? Money is piling into Tech, driving valuations sky-high, when profits for many AI-related companies are currently little more than a dream. Spoiler alert: Word Up! went out of print in 2012, and companies can NOT lose ungodly sums of money indefinitely.
Because money is piling into Tech, it is NOT piling into areas other than Tech, despite the immediate upside of AI applications at a discount.
Running Oak helps clients invest in PROFITABLE companies that are in a position to immediately benefit from BOTH AI and the current broken business models of many AI companies. Why buy the whole cow, pay for the hay, the barn, the milk maid, the homogenization, and the bottles, when you can get the milk for a sizable discount?
If nothing else and if you’re feeling especially saucy, invest in both income scenarios: Running Oak (the bottom with a large positive number) and QQQ.
Double, double toil and trouble; fire burn and cauldron BUBBLE
Everywhere, pundits and strategists are saying we’re currently in a bubble. They all then immediately add “but it won’t pop for a while.” Am I the only person who has never seen a bubble NOT pop? I don’t understand the whole “ride the bubble” narrative. I was once a kid; I have 3 kids; I have seen A LOT of bubbles. Every single one has popped, and the popping has always taken me by surprise, even though it was expected. Maybe others can predict these things… and ride them.
- What-If Analysis – A common decision-making technique used to evaluate how changes in key inputs affect an outcome, because – you know – a particular return on investment isn’t guaranteed.
What if the trillions slated to be invested in AI capex and infrastructure fail to pay off in a timely manner? Bain "estimates that the AI industry will need $2 trillion in annual revenue by 2030 to fund the necessary computing power and keep pace with demand." To fund are the key words. They don't say "to make giant piles of money" or "to justify the trillions invested over the prior 5 years with little return". Not too long ago, Meta invested heavily. Here's how that went:

Meta failed to deliver positive results in a timely manner, disappointing investors, and the stock price declined 77%. I'm not saying this will happen. I'm simply saying "What if?.
- Investment: The purchase of an asset — such as stocks, bonds, property, or a business — with the goal of earning income (like dividends, interest, or rent) or capital appreciation (an increase in value).
In this particular instance, we’re focusing on stocks. We’ll break return on investment into 2 pieces: Earning Income and Capital Appreciation.
Earning Income – Simple analysis of the largest holdings in most portfolios
- Tesla (P/E of 260) – It will take 260 years of current earnings to break even on a dollar invested today. Well… patience is a virtue, they say. (That is based upon the income Tesla is producing and no growth.)
- Apple (P/E of 39) - It will take 39 years of current earnings to break even on a dollar invested today. (That is based upon the income Apple is producing and no growth.)
- Microsoft (Price to Sales of 13.7) – Every penny in revenue must be paid back to shareholders for almost 14 years to break even. That assumes no growth but also assumes Microsoft has no employees, no costs, and investors don’t pay taxes. Note: Microsoft has 228,000 employees, who aren’t donating their time.
- Oracle (Price to Sales of 14) – Every penny in revenue must be paid back to shareholders for 14 years to break even. That assumes no growth but also assumes Oracle has no employees, no costs, and investors don’t pay taxes. Oracle has 162,000 employees, who aren’t donating their time.
What if...
- Tesla reverts to 2x the long-term S&P 500 average PE of 16: -87%
- Apple reverts to its long-term PE of 15: -63%
- Microsoft reverts to 2x the long-term S&P 500 average P/S of 3.2: -76%
- Oracle reverts to 2x the long-term S&P 500 average P/S of 3.2: -77%
Again, I'm not saying this will happen. I’m saying “What if?”. Afterall, that’s the purpose of What If Analysis and managers/financial advisors. Nothing destroys well-laid financial plans and dreams like the “What if?”.
Capital Appreciation – Unless investors are content with 40 to 250 years to break even, they are banking on capital appreciation. Assuming that is the case, what PE or Price to Sales would that equate to? A PE of 500 for Tesla? That would mean risking 87% to make 100% when -87% still reflects 2x a typical valuation – as opposed to 16x normal.
The forward PE of the 10 largest holdings in the S&P 500 is now 53% HIGHER than in the Tech Bubble.

Warren Buffett, arguably one of the greatest investors ever, said Market Cap to GDP is "probably the best single measure of where valuations stand at any given moment". The stock market is 50% MORE untethered to the real world than the Tech Bubble.
Companies that lose money going up 2x companies that make money.
The S&P 600, which utilizes a Profitability screen, has lagged the Russell 2000 to a degree not seen since the Tech Bubble. Losing money > Making money.

The last 6 months: Making money, High Quality, Lower volatility getting smoked to a historic degree by Meme stocks, Momentum, and High Volatility.

How it's going - "You can safely ride this bubble for years!", followed by misappropriated Charlie Munger quotes

How it went (Note: Berkshire is sitting on $344B in cash, the most ever. Charlie Munger and Warren Buffett are ACTIVE managers, who sell when they believe it makes sense to do so.)

High Quality, companies that make money and haven't mortgaged the future of shareholders, has experienced its second worst performance in history.

Why Invest in Efficient Growth:
- Top Decile: Running Oak’s Efficient Growth separate account has performed in the top decile of all Mid Cap Core funds - despite being historically out of favor - in Morningstar's database over the last 10 years, net of fees.1
- Opportune: A little known - yet very large - hole exists in the typical equity portfolio, precisely where the most attractive risk/reward asymmetry currently lies. Efficient Growth fills that hole - and opportunity - like few portfolios do.
- 5 Stars: Efficient Growth has a 5-Star Morningstar rating.
- Since inception, Efficient Growth has provided 16% more return than the S&P 500 Equal Weight Index, given the same level of downside risk, gross of fees. (Ulcer Performance Index)*

Differentiated Approach and Construction
- Mid Cap stocks are at their cheapest in 25 years relative to Large. Efficient Growth provides significant Mid Cap exposure.
- Efficient Growth is built upon 3 longstanding, common sense principles: maximize earnings growth, strictly avoid inflated valuations, protect to the downside.
- Running Oak utilizes a highly disciplined, rules-based process, resulting in a portfolio that is reliable, repeatable, and unemotional.
How to Invest
- Efficient Growth is currently available as an SMA and ETF. (ETF specifics and SMA historical performance can't be shared in the same letter - sorry, it's annoying, I know. Please inquire for the ticker or more information.)
- In just over 2 years, The ETF Which Shall Not Be Named has grown 19,000% since launch - from 2 to 380mm.
Performance Update
- Running Oak’s Efficient Growth portfolio was down -0.77%, gross of fees (0.81%, net), in September.*
Quick hitters:
Consistently Not Stupid - Running Oak in 3 Words
Invest Where Others Aren't (MARGE - Upper Mid/Lower Large Cap)
- Investing where everyone else is investing means higher prices, higher valuations, lower implied returns, higher implied downside.
- Investing where others aren't means lower prices, lower valuations, higher implied returns, lower implied downside and a margin of error.
- Investing where others aren't also provides valuable diversification.
- If the market goes up, others are likely to follow, propelling prices.
- If the market goes down, others can't sell what they don't own, meaning less selling and downside pressure.
It's win/win.
Running Oak's goal is to maximize the exponential growth of clients' portfolios, while subjecting them to far less risk of loss. In other words, we aim to help your clients realize their dreams and avoid their nightmares.
If you appreciate critical thinking, math, common sense, and occasional sarcasm, we would love to speak with you. Please feel free to set up a time here: Schedule a call.
Seth L. Cogswell
Founder and Managing Partner
Edina, MN 55424
P +1 919.656.3712
For additional data and context regarding the claims made within this letter, please refer to the Disclosures and Additional Data document located here.
Investment Advisory Services are offered through Running Oak Capital, a registered investment adviser.
The opinions voiced in this material are those of Running Oak Capital’s, do not constitute investment advice, and are not intended as recommendations for any individual. To determine which investments and strategies may be appropriate for you, consult with us at Running Oak Capital or another trusted investment adviser.
*Past performance is no guarantee of future results. Performance expectations are no guarantee of future results; they reflect educated guesses that may or may not come to fruition. All indices are unmanaged and may not be invested into directly.
*Returns prior to September of 2013, while unaudited, were documented and generated on a real-time (not back-tested) basis. Such results are from accounts managed at other entities prior to the formation of Running Oak Capital. It reflects the strategy’s performance since the beginning of 1989. Downside risk is calculated by dividing the average drawdown of the strategy, observed on a quarterly basis, by the average drawdown of the S&P 500 index since 1989.
*Statements regarding the large gap in the middle of the typical equity allocation reflect the opinion of Running Oak Capital This is based on informal feedback and experience from interactions with investors and other financial professionals. Further, statements on where the most attractive risk/reward asymmetry lie, although based on observable data, reflect the opinion of Running Oak Capital.
*Statement regarding Mid Cap stocks outperforming Large is reflective of historical performance of the Russel Midcap Index vs Russell 1000 Index.
*Source of Mid Cap undervaluation & Large Cap overvaluation: Bloomberg
Latest articles

This data feed is not available at this time.
Data is currently not available