
Synchrony Finl (NYSE:SYF) is preparing to release its quarterly earnings on Tuesday, 2025-07-22. Here's a brief overview of what investors should keep in mind before the announcement.
Analysts expect Synchrony Finl to report an earnings per share (EPS) of $1.71.
Synchrony Finl bulls will hope to hear the company announce they've not only beaten that estimate, but also to provide positive guidance, or forecasted growth, for the next quarter.
New investors should note that it is sometimes not an earnings beat or miss that most affects the price of a stock, but the guidance (or forecast).
Overview of Past Earnings
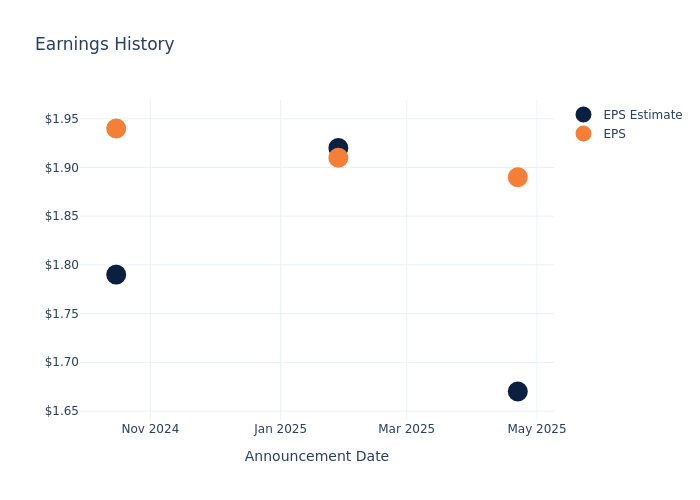
The company's EPS beat by $0.22 in the last quarter, leading to a 2.78% increase in the share price on the following day.
Here's a look at Synchrony Finl's past performance and the resulting price change:
| Quarter | Q1 2025 | Q4 2024 | Q3 2024 | Q2 2024 |
|---|---|---|---|---|
| EPS Estimate | 1.67 | 1.92 | 1.79 | 1.35 |
| EPS Actual | 1.89 | 1.91 | 1.94 | 1.55 |
| Price Change % | 3.0% | 3.0% | 0.0% | -3.0% |
Performance of Synchrony Finl Shares
Shares of Synchrony Finl were trading at $70.04 as of July 18. Over the last 52-week period, shares are up 38.7%. Given that these returns are generally positive, long-term shareholders are likely bullish going into this earnings release.
Analyst Observations about Synchrony Finl
Understanding market sentiments and expectations within the industry is crucial for investors. This analysis delves into the latest insights on Synchrony Finl.
The consensus rating for Synchrony Finl is Outperform, derived from 11 analyst ratings. An average one-year price target of $70.0 implies a potential 0.06% downside.
Peer Ratings Comparison
The below comparison of the analyst ratings and average 1-year price targets of Dave and Enova International, three prominent players in the industry, gives insights for their relative performance expectations and market positioning.
- Analysts currently favor an Buy trajectory for Dave, with an average 1-year price target of $234.73, suggesting a potential 235.14% upside.
- Analysts currently favor an Buy trajectory for Enova International, with an average 1-year price target of $129.5, suggesting a potential 84.89% upside.
Peer Metrics Summary
The peer analysis summary presents essential metrics for Dave and Enova International, unveiling their respective standings within the industry and providing valuable insights into their market positions and comparative performance.
| Company | Consensus | Revenue Growth | Gross Profit | Return on Equity |
|---|---|---|---|---|
| Kaspi.kz | Outperform | 48.67% | $430.02B | 15.62% |
| Dave | Buy | 46.65% | $100.87M | 15.06% |
| Enova International | Buy | 22.24% | $345.64M | 6.10% |
Key Takeaway:
Synchrony Finl ranks highest in Gross Profit among its peers. It is in the middle for Revenue Growth and Return on Equity.
Discovering Synchrony Finl: A Closer Look
Synchrony Financial, originally a spinoff of GE Capital's retail financing business, is the largest provider of private-label credit cards in the United States by both outstanding receivables and purchasing volume. Synchrony partners with other firms to market its credit products in their physical stores as well as on their websites and mobile applications. Synchrony operates through three segments: retail card (private-label and co-branded general-purpose credit cards), payment solutions (promotional financing for large ticket purchases), and CareCredit (financing for elective healthcare procedures).
Understanding the Numbers: Synchrony Finl's Finances
Market Capitalization: Surpassing industry standards, the company's market capitalization asserts its dominance in terms of size, suggesting a robust market position.
Decline in Revenue: Over the 3 months period, Synchrony Finl faced challenges, resulting in a decline of approximately -0.29% in revenue growth as of 31 March, 2025. This signifies a reduction in the company's top-line earnings. When compared to others in the Financials sector, the company faces challenges, achieving a growth rate lower than the average among peers.
Net Margin: Synchrony Finl's financial strength is reflected in its exceptional net margin, which exceeds industry averages. With a remarkable net margin of 19.8%, the company showcases strong profitability and effective cost management.
Return on Equity (ROE): Synchrony Finl's ROE is below industry averages, indicating potential challenges in efficiently utilizing equity capital. With an ROE of 4.79%, the company may face hurdles in achieving optimal financial returns.
Return on Assets (ROA): The company's ROA is below industry benchmarks, signaling potential difficulties in efficiently utilizing assets. With an ROA of 0.61%, the company may need to address challenges in generating satisfactory returns from its assets.
Debt Management: Synchrony Finl's debt-to-equity ratio is below the industry average. With a ratio of 1.11, the company relies less on debt financing, maintaining a healthier balance between debt and equity, which can be viewed positively by investors.
To track all earnings releases for Synchrony Finl visit their earnings calendar on our site.
This article was generated by Benzinga's automated content engine and reviewed by an editor.
Latest Ratings for SYF
| Date | Firm | Action | From | To |
|---|---|---|---|---|
| Jul 2025 | JMP Securities | Maintains | Market Outperform | Market Outperform |
| Jul 2025 | BTIG | Upgrades | Neutral | Buy |
| Jul 2025 | JP Morgan | Maintains | Overweight | Overweight |
View More Analyst Ratings for SYF
View the Latest Analyst Ratings
© 2025 Benzinga.com. Benzinga does not provide investment advice. All rights reserved.
The views and opinions expressed herein are the views and opinions of the author and do not necessarily reflect those of Nasdaq, Inc.

