
Many investors are still learning about the various metrics that can be useful when analysing a stock. This article is for those who would like to learn about Return On Equity (ROE). By way of learning-by-doing, we'll look at ROE to gain a better understanding of NiSource Inc. (NYSE:NI).
ROE or return on equity is a useful tool to assess how effectively a company can generate returns on the investment it received from its shareholders. Put another way, it reveals the company's success at turning shareholder investments into profits.
How Is ROE Calculated?
ROE can be calculated by using the formula:
Return on Equity = Net Profit (from continuing operations) ÷ Shareholders' Equity
So, based on the above formula, the ROE for NiSource is:
9.6% = US$723m ÷ US$7.5b (Based on the trailing twelve months to June 2022).
The 'return' is the yearly profit. That means that for every $1 worth of shareholders' equity, the company generated $0.10 in profit.
Does NiSource Have A Good Return On Equity?
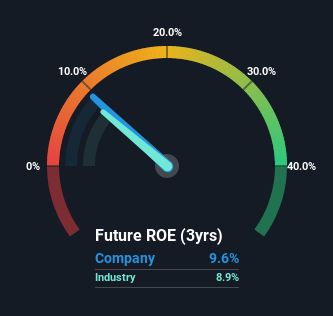
One simple way to determine if a company has a good return on equity is to compare it to the average for its industry. However, this method is only useful as a rough check, because companies do differ quite a bit within the same industry classification. If you look at the image below, you can see NiSource has a similar ROE to the average in the Integrated Utilities industry classification (8.9%).
That isn't amazing, but it is respectable. Although the ROE is similar to the industry, we should still perform further checks to see if the company's ROE is being boosted by high debt levels. If true, then it is more an indication of risk than the potential. To know the 3 risks we have identified for NiSource visit our risks dashboard for free.
The Importance Of Debt To Return On Equity
Most companies need money -- from somewhere -- to grow their profits. That cash can come from issuing shares, retained earnings, or debt. In the first and second cases, the ROE will reflect this use of cash for investment in the business. In the latter case, the use of debt will improve the returns, but will not change the equity. That will make the ROE look better than if no debt was used.
NiSource's Debt And Its 9.6% ROE
It's worth noting the high use of debt by NiSource, leading to its debt to equity ratio of 1.34. With a fairly low ROE, and significant use of debt, it's hard to get excited about this business at the moment. Debt increases risk and reduces options for the company in the future, so you generally want to see some good returns from using it.
Summary
Return on equity is useful for comparing the quality of different businesses. Companies that can achieve high returns on equity without too much debt are generally of good quality. If two companies have around the same level of debt to equity, and one has a higher ROE, I'd generally prefer the one with higher ROE.
But when a business is high quality, the market often bids it up to a price that reflects this. The rate at which profits are likely to grow, relative to the expectations of profit growth reflected in the current price, must be considered, too. So I think it may be worth checking this free report on analyst forecasts for the company.
Of course, you might find a fantastic investment by looking elsewhere. So take a peek at this free list of interesting companies.
Have feedback on this article? Concerned about the content? Get in touch with us directly. Alternatively, email editorial-team (at) simplywallst.com.
This article by Simply Wall St is general in nature. We provide commentary based on historical data and analyst forecasts only using an unbiased methodology and our articles are not intended to be financial advice. It does not constitute a recommendation to buy or sell any stock, and does not take account of your objectives, or your financial situation. We aim to bring you long-term focused analysis driven by fundamental data. Note that our analysis may not factor in the latest price-sensitive company announcements or qualitative material. Simply Wall St has no position in any stocks mentioned.
The views and opinions expressed herein are the views and opinions of the author and do not necessarily reflect those of Nasdaq, Inc.

