
In the fast-paced and cutthroat world of business, conducting thorough company analysis is essential for investors and industry experts. In this article, we will undertake a comprehensive industry comparison, evaluating NVIDIA (NASDAQ:NVDA) in comparison to its major competitors within the Semiconductors & Semiconductor Equipment industry. By analyzing crucial financial metrics, market position, and growth potential, our objective is to provide valuable insights for investors and offer a deeper understanding of company's performance in the industry.
NVIDIA Background
Nvidia is a leading developer of graphics processing units. Traditionally, GPUs were used to enhance the experience on computing platforms, most notably in gaming applications on PCs. GPU use cases have since emerged as important semiconductors used in artificial intelligence. Nvidia not only offers AI GPUs, but also a software platform, Cuda, used for AI model development and training. Nvidia is also expanding its data center networking solutions, helping to tie GPUs together to handle complex workloads.
| Company | P/E | P/B | P/S | ROE | EBITDA (in billions) | Gross Profit (in billions) | Revenue Growth |
|---|---|---|---|---|---|---|---|
| NVIDIA Corp | 46.03 | 41.61 | 25.72 | 30.42% | $25.82 | $28.72 | 77.94% |
| Broadcom Inc | 107.46 | 15.64 | 20.52 | 8.01% | $8.54 | $10.14 | 24.71% |
| Advanced Micro Devices Inc | 85.93 | 3.30 | 6.93 | 1.23% | $1.59 | $3.74 | 35.9% |
| Texas Instruments Inc | 35.48 | 10.37 | 10.72 | 7.08% | $1.85 | $2.31 | 11.14% |
| Qualcomm Inc | 15.61 | 6.06 | 4.07 | 10.3% | $3.67 | $6.04 | 16.93% |
| ARM Holdings PLC | 177.93 | 20.57 | 35.40 | 3.17% | $0.22 | $0.95 | 26.25% |
| Analog Devices Inc | 72.47 | 3.21 | 12.11 | 1.11% | $1.03 | $1.43 | -3.56% |
| Micron Technology Inc | 22.80 | 2.19 | 3.43 | 3.32% | $3.95 | $2.96 | 38.27% |
| Monolithic Power Systems Inc | 19.59 | 10.76 | 14.95 | 4.17% | $0.18 | $0.35 | 39.24% |
| STMicroelectronics NV | 22.09 | 1.31 | 1.98 | 0.32% | $0.51 | $0.84 | -27.36% |
| ASE Technology Holding Co Ltd | 20.48 | 2.16 | 1.12 | 2.39% | $27.16 | $24.89 | 11.56% |
| First Solar Inc | 16.40 | 2.53 | 4.87 | 2.59% | $0.35 | $0.34 | 6.35% |
| United Microelectronics Corp | 12.63 | 1.51 | 2.47 | 2.06% | $23.86 | $15.45 | 5.91% |
| ON Semiconductor Corp | 31.39 | 2.35 | 2.91 | -5.78% | $-0.37 | $0.29 | -22.39% |
| Skyworks Solutions Inc | 28.22 | 1.87 | 2.94 | 1.11% | $0.22 | $0.39 | -8.87% |
| Credo Technology Group Holding Ltd | 1993 | 16.42 | 32.20 | 4.95% | $0.03 | $0.09 | 154.44% |
| Lattice Semiconductor Corp | 148.38 | 10.66 | 15.52 | 0.71% | $0.02 | $0.08 | -14.68% |
| Qorvo Inc | 136.97 | 2.19 | 2.04 | 0.93% | $0.14 | $0.39 | -5.11% |
| Universal Display Corp | 32.02 | 4.41 | 11.32 | 3.93% | $0.08 | $0.13 | 0.62% |
| Average | 165.49 | 6.53 | 10.31 | 2.87% | $4.06 | $3.93 | 16.08% |
After a detailed analysis of NVIDIA, the following trends become apparent:
-
The Price to Earnings ratio of 46.03 is 0.28x lower than the industry average, indicating potential undervaluation for the stock.
-
The elevated Price to Book ratio of 41.61 relative to the industry average by 6.37x suggests company might be overvalued based on its book value.
-
The stock's relatively high Price to Sales ratio of 25.72, surpassing the industry average by 2.49x, may indicate an aspect of overvaluation in terms of sales performance.
-
The Return on Equity (ROE) of 30.42% is 27.55% above the industry average, highlighting efficient use of equity to generate profits.
-
With higher Earnings Before Interest, Taxes, Depreciation, and Amortization (EBITDA) of $25.82 Billion, which is 6.36x above the industry average, the company demonstrates stronger profitability and robust cash flow generation.
-
With higher gross profit of $28.72 Billion, which indicates 7.31x above the industry average, the company demonstrates stronger profitability and higher earnings from its core operations.
-
The company is experiencing remarkable revenue growth, with a rate of 77.94%, outperforming the industry average of 16.08%.
Debt To Equity Ratio
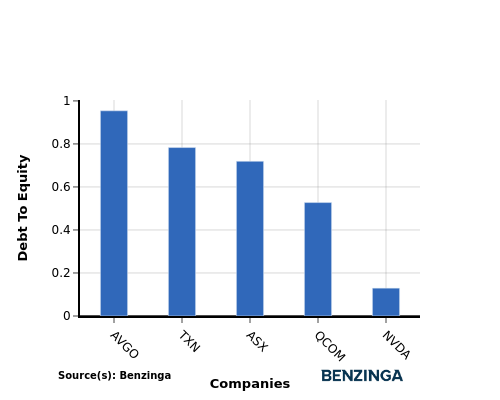
The debt-to-equity (D/E) ratio provides insights into the proportion of debt a company has in relation to its equity and asset value.
Considering the debt-to-equity ratio in industry comparisons allows for a concise evaluation of a company's financial health and risk profile, aiding in informed decision-making.
In light of the Debt-to-Equity ratio, a comparison between NVIDIA and its top 4 peers reveals the following information:
-
NVIDIA exhibits a stronger financial position compared to its top 4 peers in the sector, as indicated by its lower debt-to-equity ratio of 0.13.
-
This suggests that the company has a more favorable balance between debt and equity, which can be seen as a positive aspect for investors.
Key Takeaways
For NVIDIA in the Semiconductors & Semiconductor Equipment industry, the PE, PB, and PS ratios indicate that the stock is relatively undervalued compared to its peers. On the other hand, the high ROE, EBITDA, gross profit, and revenue growth suggest that NVIDIA is performing exceptionally well in terms of profitability and growth within the industry sector.
This article was generated by Benzinga's automated content engine and reviewed by an editor.
Latest Ratings for NVDA
| Date | Firm | Action | From | To |
|---|---|---|---|---|
| May 2025 | B of A Securities | Maintains | Buy | Buy |
| May 2025 | UBS | Maintains | Buy | Buy |
| Apr 2025 | Seaport Global | Initiates Coverage On | Sell |
View More Analyst Ratings for NVDA
View the Latest Analyst Ratings
© 2025 Benzinga.com. Benzinga does not provide investment advice. All rights reserved.
The views and opinions expressed herein are the views and opinions of the author and do not necessarily reflect those of Nasdaq, Inc.

