
Chord Energy (NASDAQ:CHRD) underwent analysis by 11 analysts in the last quarter, revealing a spectrum of viewpoints from bullish to bearish.
The table below provides a snapshot of their recent ratings, showcasing how sentiments have evolved over the past 30 days and comparing them to the preceding months.
| Bullish | Somewhat Bullish | Indifferent | Somewhat Bearish | Bearish | |
|---|---|---|---|---|---|
| Total Ratings | 3 | 6 | 2 | 0 | 0 |
| Last 30D | 0 | 1 | 0 | 0 | 0 |
| 1M Ago | 1 | 0 | 0 | 0 | 0 |
| 2M Ago | 1 | 2 | 0 | 0 | 0 |
| 3M Ago | 1 | 3 | 2 | 0 | 0 |
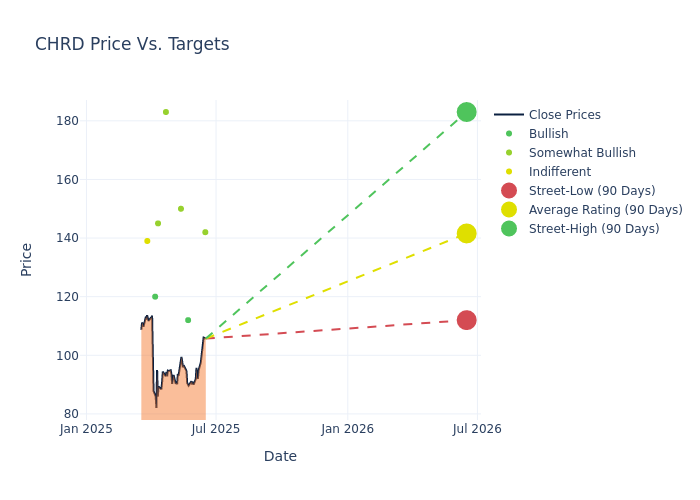
Analysts have recently evaluated Chord Energy and provided 12-month price targets. The average target is $141.27, accompanied by a high estimate of $183.00 and a low estimate of $112.00. A decline of 7.17% from the prior average price target is evident in the current average.
Decoding Analyst Ratings: A Detailed Look
The standing of Chord Energy among financial experts becomes clear with a thorough analysis of recent analyst actions. The summary below outlines key analysts, their recent evaluations, and adjustments to ratings and price targets.
| Analyst | Analyst Firm | Action Taken | Rating | Current Price Target | Prior Price Target |
|---|---|---|---|---|---|
| Hanwen Chang | Wells Fargo | Lowers | Overweight | $142.00 | $158.00 |
| Noah Hungness | B of A Securities | Lowers | Buy | $112.00 | $114.00 |
| Nitin Kumar | Mizuho | Lowers | Outperform | $150.00 | $154.00 |
| Noah Hungness | B of A Securities | Lowers | Buy | $114.00 | $125.00 |
| Mark Lear | Piper Sandler | Lowers | Overweight | $183.00 | $184.00 |
| Hanwen Chang | Wells Fargo | Lowers | Overweight | $158.00 | $166.00 |
| Scott Hanold | RBC Capital | Lowers | Outperform | $145.00 | $165.00 |
| Paul Diamond | Citigroup | Lowers | Buy | $120.00 | $135.00 |
| Noah Hungness | B of A Securities | Lowers | Neutral | $125.00 | $138.00 |
| Devin McDermott | Morgan Stanley | Lowers | Equal-Weight | $139.00 | $160.00 |
| Hanwen Chang | Wells Fargo | Lowers | Overweight | $166.00 | $175.00 |
Key Insights:
- Action Taken: Analysts frequently update their recommendations based on evolving market conditions and company performance. Whether they 'Maintain', 'Raise' or 'Lower' their stance, it reflects their reaction to recent developments related to Chord Energy. This information provides a snapshot of how analysts perceive the current state of the company.
- Rating: Analyzing trends, analysts offer qualitative evaluations, ranging from 'Outperform' to 'Underperform'. These ratings convey expectations for the relative performance of Chord Energy compared to the broader market.
- Price Targets: Gaining insights, analysts provide estimates for the future value of Chord Energy's stock. This comparison reveals trends in analysts' expectations over time.
Analyzing these analyst evaluations alongside relevant financial metrics can provide a comprehensive view of Chord Energy's market position. Stay informed and make data-driven decisions with the assistance of our Ratings Table.
Stay up to date on Chord Energy analyst ratings.
About Chord Energy
Chord Energy Corp is an independent exploration and production company. The company acquires, exploits, develops, and explores crude oil, natural gas, and natural gas liquids in the Williston Basin.
Chord Energy: Financial Performance Dissected
Market Capitalization Analysis: Below industry benchmarks, the company's market capitalization reflects a smaller scale relative to peers. This could be attributed to factors such as growth expectations or operational capacity.
Revenue Growth: Chord Energy's remarkable performance in 3M is evident. As of 31 March, 2025, the company achieved an impressive revenue growth rate of 11.96%. This signifies a substantial increase in the company's top-line earnings. As compared to its peers, the revenue growth lags behind its industry peers. The company achieved a growth rate lower than the average among peers in Energy sector.
Net Margin: The company's net margin is a standout performer, exceeding industry averages. With an impressive net margin of 17.99%, the company showcases strong profitability and effective cost control.
Return on Equity (ROE): Chord Energy's ROE falls below industry averages, indicating challenges in efficiently using equity capital. With an ROE of 2.52%, the company may face hurdles in generating optimal returns for shareholders.
Return on Assets (ROA): Chord Energy's ROA stands out, surpassing industry averages. With an impressive ROA of 1.68%, the company demonstrates effective utilization of assets and strong financial performance.
Debt Management: Chord Energy's debt-to-equity ratio is below the industry average. With a ratio of 0.11, the company relies less on debt financing, maintaining a healthier balance between debt and equity, which can be viewed positively by investors.
The Significance of Analyst Ratings Explained
Analysts work in banking and financial systems and typically specialize in reporting for stocks or defined sectors. Analysts may attend company conference calls and meetings, research company financial statements, and communicate with insiders to publish "analyst ratings" for stocks. Analysts typically rate each stock once per quarter.
Some analysts will also offer forecasts for metrics like growth estimates, earnings, and revenue to provide further guidance on stocks. Investors who use analyst ratings should note that this specialized advice comes from humans and may be subject to error.
Breaking: Wall Street's Next Big Mover
Benzinga's #1 analyst just identified a stock poised for explosive growth. This under-the-radar company could surge 200%+ as major market shifts unfold. Click here for urgent details.
This article was generated by Benzinga's automated content engine and reviewed by an editor.
Latest Ratings for CHRD
| Date | Firm | Action | From | To |
|---|---|---|---|---|
| Jun 2025 | Wells Fargo | Maintains | Overweight | Overweight |
| May 2025 | B of A Securities | Maintains | Buy | Buy |
| May 2025 | Mizuho | Maintains | Outperform | Outperform |
View More Analyst Ratings for CHRD
View the Latest Analyst Ratings
© 2025 Benzinga.com. Benzinga does not provideinvestment advice All rights reserved.
The views and opinions expressed herein are the views and opinions of the author and do not necessarily reflect those of Nasdaq, Inc.

