
March Highlights
- Equal weight ETFs are outperforming market cap weighted funds.
- Liquidated funds’ age has plummeted to around one year driven by single stock delistings.
- Retail buying of ETFs is still positive but down 27% from February.
The State of the Market
As tensions went hot in the Middle East, March ETP performance slowed the momentum of a record breaking quarter. Through the end of first quarter, fund flows are up over 27% year over year. The trends cropping up earlier in the year - rotations from technology into physical world, and industrials, and buying heading ex-US - seem to have solidified heading into the second quarter of this year. Investors are making active bets and positioning their portfolios.

Fixed income continues to attract strong inflows—with money market funds posting another double‑digit growth month and over $170B in March cashflows alone—while slowing overall cashflows and a narrowing gap versus equity flows reflect rising investor caution amid geopolitical tensions, private‑market instability, and AI uncertainty, leaving broad US equity ETFs as the biggest losers (over $50B YTD outflows from IVV, SPY, and QQQ) in contrast to VOO’s nearly $20B in inflows, highlighting the impact of strong distribution.

Outflows from broad equity are buoyed by the underperformance of the Mag-7. Investors are aware that mega caps have had an incredible run over the first half of the 2020's and what goes up may eventually come down. While the S&P 500 is down nearly 5%, the equal weighted S&P 500 is slightly up for the year. Worried that the cracks forming may solidify, investors are moving to the sidelines or away from megacap exposure to more specific plays.

Money market funds have had an incredible start to the year with over 15% in YTD organic growth due to several factors. Money market funds currently have relatively high yield despite the lower rate regime. Favorable yields are compounded by the uncertainty in the market. As incredibly low risk tools, investors can comfortably sit in money market funds while avoiding turbulence. ETF issuers have noticed the increased interest and have been launching money market funds over the past year.
ETF issuers like Proshares and Simplify have also begun using money market ETFs as cash management tools. Proshares launched the Proshares GENIUS Money Market ETF (IQMM) and it is now held by several of their funds to centralize cash management. Simplify has done the same with SBIL. They are also structuring these money market ETFs to be used in tokenization. IQMM was designed intentionally to back stable coins 1:1 under the GENIUS act with highly liquid assets.

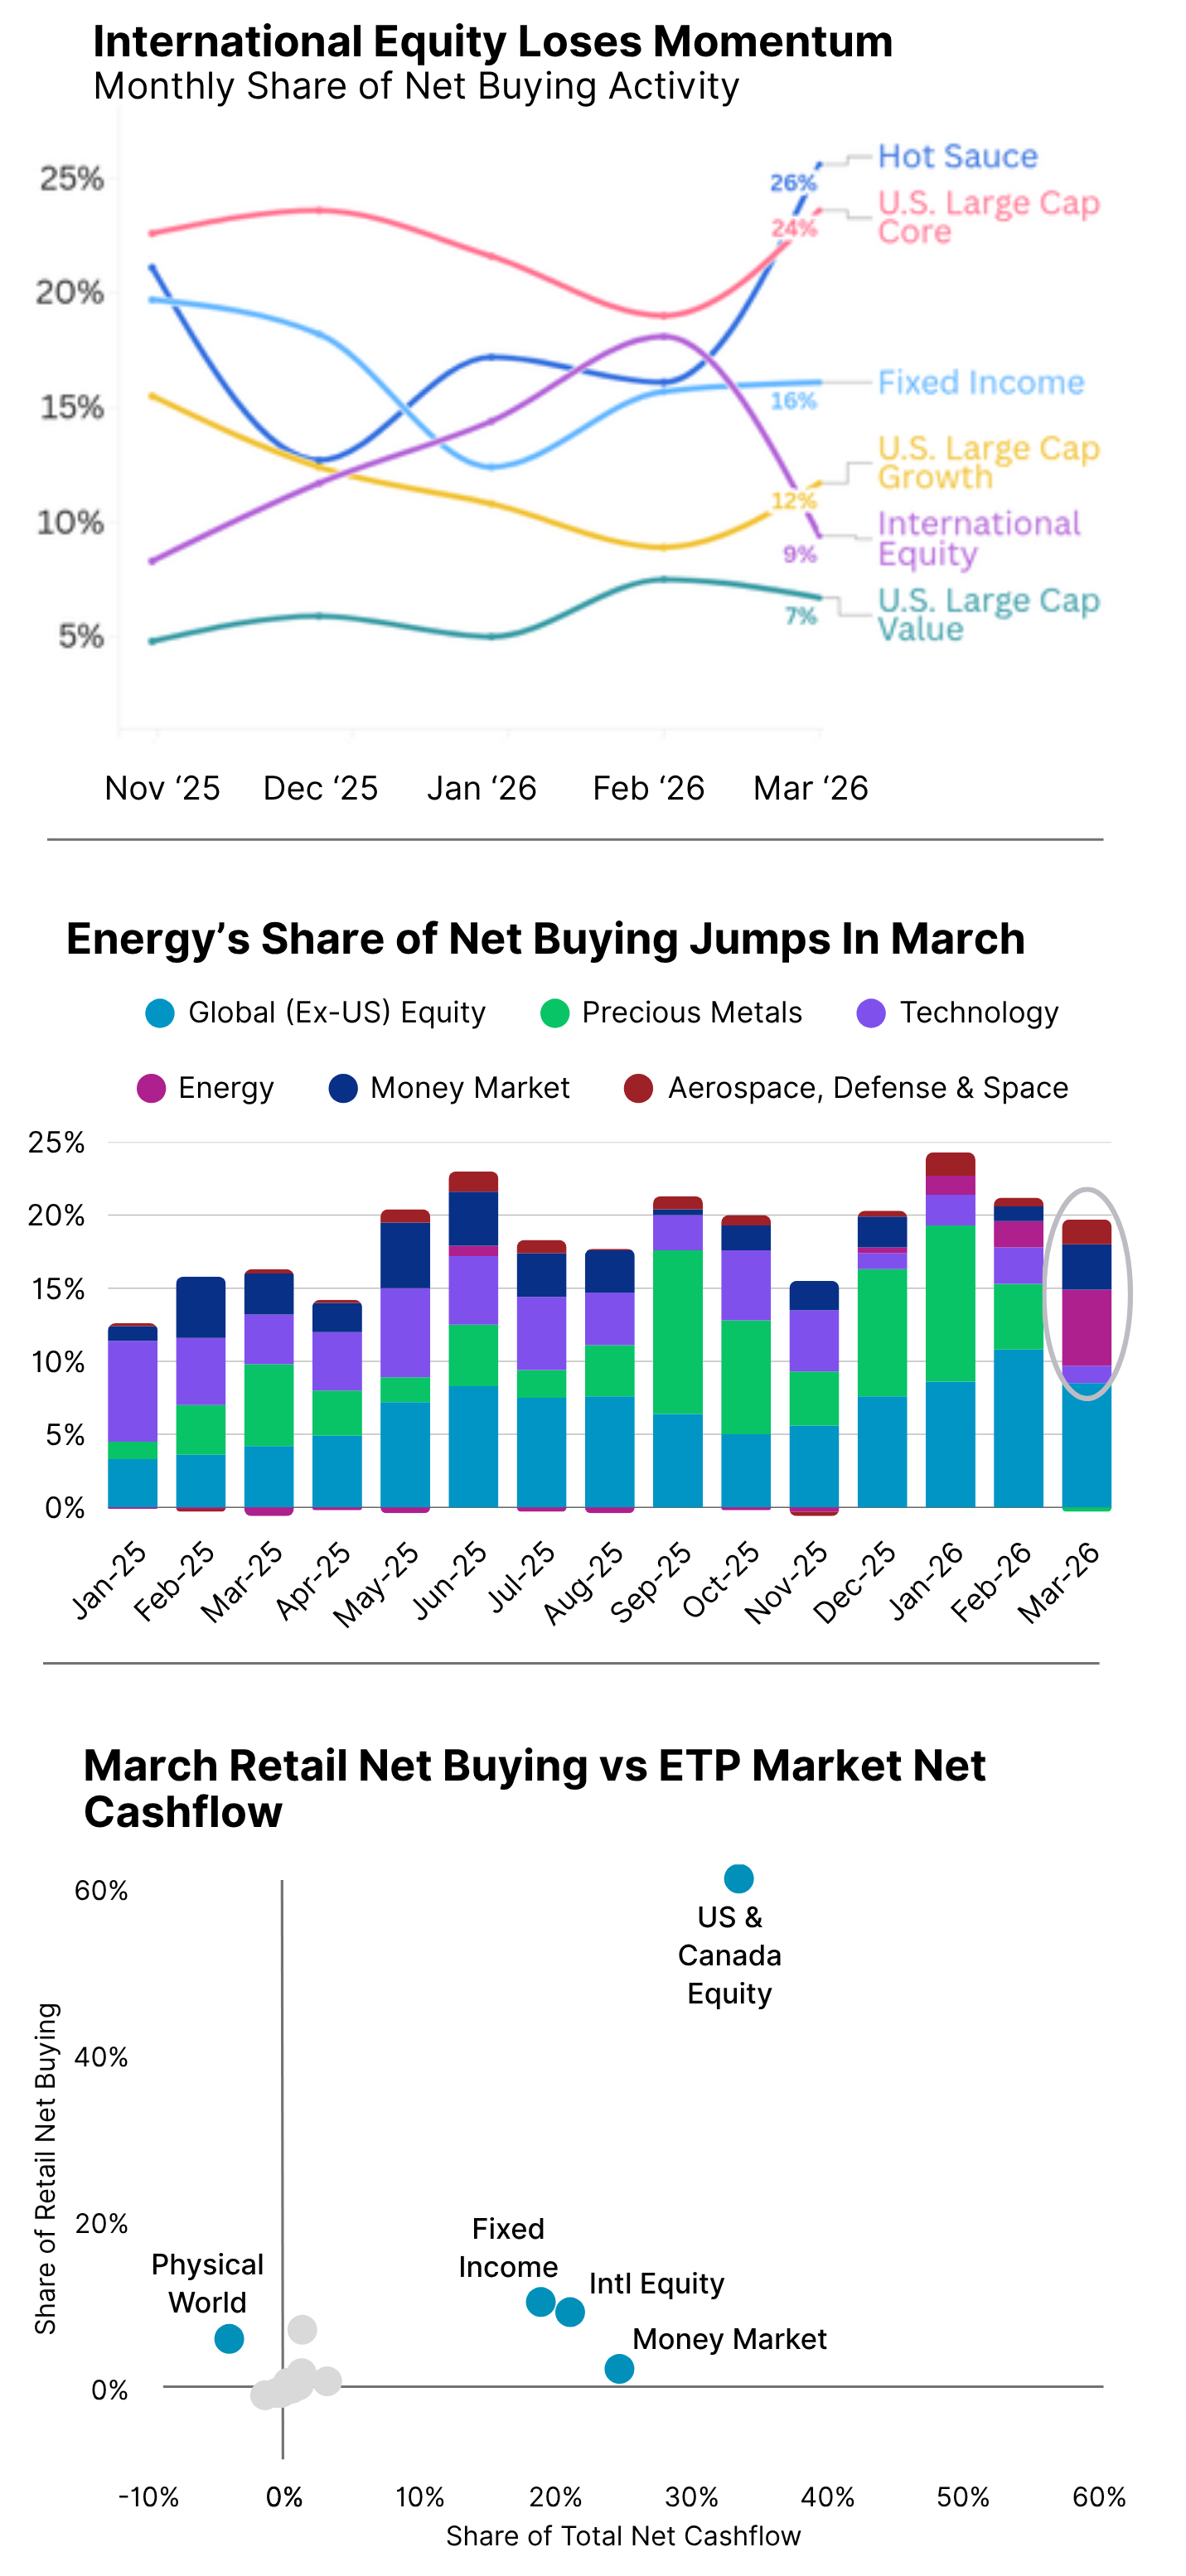
Globally market share of cashflow to industrial ETFs has increased in 2026 and aerospace and defense is driving the bulk of that increase, capturing 69% of flows headed towards industrial equity ETFs. Aerospace and defense had its largest ever monthly inflow of $5.9B. This month’s flows were led by the iShares Defense Industrials Active ETF (IDEF) which captured over $3.4B in flows. Investors are looking at the growing tensions globally and the increase in defense spending and placing bets on the trend continuing. Issuers have noticed and responded to interest in aerospace and defense growing. The number of ETFs in the category has gone from nine to sixteen in the past year.
March was defined by the convergence of a major geopolitical crisis, entrenched inflation, and elevated market volatility, leading to retail investor allocation preferences shifting quickly during the month. Where investors adopted a diversification and momentum posture from November to February, March activity started to return to the mean. Net buying activity dropped 26% from February, with investors allocating to core equity, fixed income funds as well as towards the hot sauce category.
International equity has begun to lose its luster for retail investors as share of net buying returned to Q4 2025 levels. Institutional and retail have diverged. Retail is returning to hot sauce and is shying away from a more diversified approach. The other major difference between the two is levels of investment in money market funds. Retail is minimally investing in money market funds while institutional investors are starting to look for safe havens.
In January 2026, precious metals combined for 10.7% of all retail net buying, but by March, it had dropped to a share of 0.2%. Self directed investors completely cooled off on what was their third-largest allocation in January, following the trend in the broader market.
Energy ETFs under both the Commodities and Hot Sauce umbrellas saw substantial jumps in retail interest with oil and natural gas ETFs gathering the lion’s share of net buying. Sector Energy experienced net selling negative in November with a -0.1% share but swung to 2.3% share by March. When combined with Theme Equity, energy accounted for nearly 3.8% of all March net buying, up from essentially zero five months ago, suggesting retail investors are aggressively pricing in supply disruptions.
A Tale of Two Shares: Issuer Revenue vs Issuer Assets

The ETF retail landscape remains dominated by a handful of issuers that collectively control over 70% of total AUM, with Vanguard consistently capturing the largest share of retail net buying (around 27% over the last 2 years) driven by its ultra-low expense ratios. A notable shift is underway as issuers focusing on hot sauce category of funds such as Neos Funds, YieldMax ETFs, Defiance, Volatility Shares and REX Shares are experiencing strong revenue growth, reflecting surging self directed investor demand for income-oriented and alternative strategies that have higher expense ratio.
Meanwhile, several established players, including State Street, Vanguard, ProShares, and Direxion, are seeing their share of retail net buying decline suggesting a redistribution of investor attention toward newer, higher-conviction offerings. Revenue concentration favors high-fee issuers, as firms with expense ratios above 0.75% generate outsized retail revenues relative to their AUM, while the long tail of hundreds of smaller issuers collectively experiences persistent net selling.
China Continues to Sell off Broad Equity Funds

After nearly $140B in selling from broad equity ETFs by Chinese national accounts in January, outflow from broad equity ETFs in China have continued, albeit at a slower pace. February saw $12B in outflows and March saw $6.6B. The selling was purported to be for the purpose of artificially cooling demand in Chinese markets and creating a more sustainable, less frantic bull market. The overall downtrend within broad equity seems to have naturally dropped demand regardless of selling by the national accounts. The CSI 300 is down around 4% on the year, slightly outperforming the broader U.S. market. Similarly to U.S. investors, Chinese investors are buying thematics. Sector, thematic, and commodity funds are the only high level categories to receive significant inflows this year.
New Kids on the Block

U.S. Filing Trends

52 issuers filed for 327 funds this month. Within option overlay funds an interesting trend is starting to emerge. In prior years, the majority of option overlay funds had broad equities as their underlying exposure. Recently, there are an increasing number of filings using a theme as the underlying exposure like the Kurv Gold & Mining Enhanced Income ETF. The broad equity option overlay space has become increasingly crowded and with thematics on an upswing issuers are see it as an underdeveloped space that is ripe for the picking.
A fifth of funds filed were filed with the help of a white labeler. The majority of white labeler filings are single stock funds but they are also filing for factor funds. The issuers on the single stock side tend to be more established while issuers filing for factor products tend to have a limited or nonexistent lineup of ETFs and are entering the space for the first or second time.
Delistings are Getting Younger
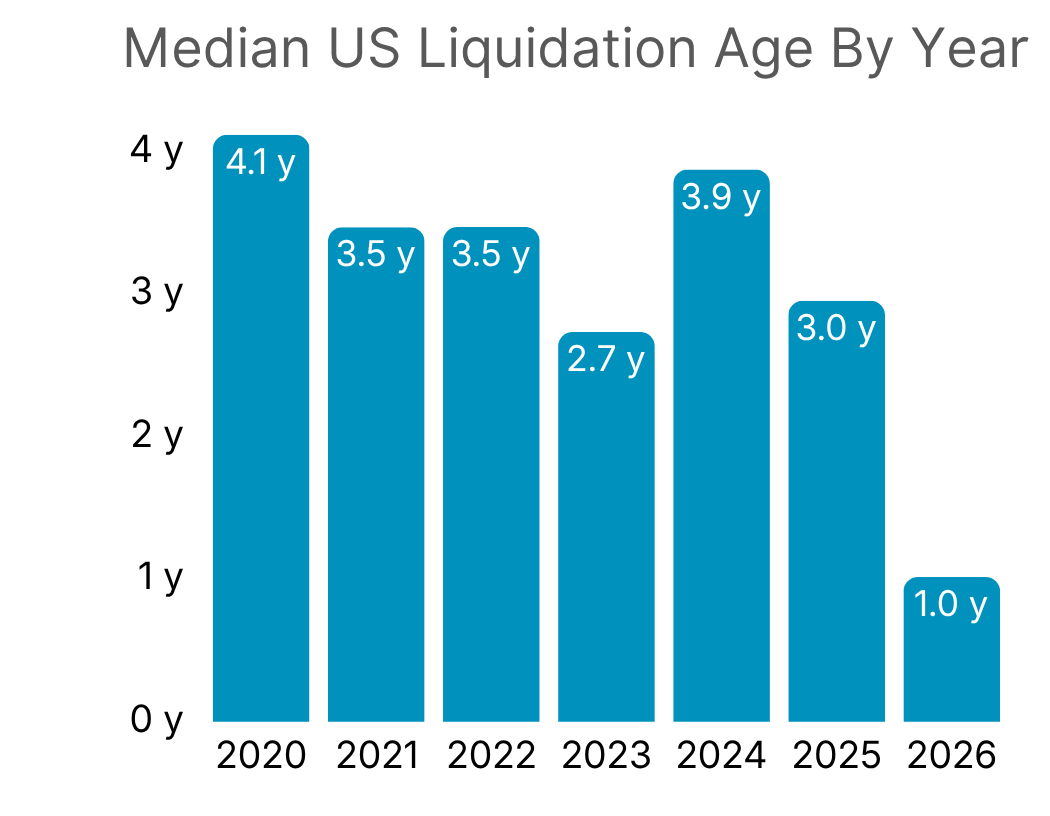
Liquidated funds’ age at the time of delisting have drastically decreased in the first quarter of 2026. Historically, funds that liquidate tend to delist around the age of three years when issuers have a clearer view of if an ETF is going to gain institutional footholds. However, as markets have evolved and retail has become much more involved with ETFs, issuer behavior is changing.
23 of the 58 delistings this year so far were single stock funds while only nine of the 191 last year were single stock. The choppier markets over the past few months likely contributed but the other factor is the expected buyer. Single stock products are almost exclusively designed for retail so there isn’t the same delay where platforms are looking for three year history and issuers may have more immediate feedback that they feel confident acting on and shutting down the fund.


Latest articles

This data feed is not available at this time.
Data is currently not available