

Within the financial advisor and asset management field, the overarching comfort in rising asset prices regardless of the reason why is truly something to behold. Asset price growth driven by wage, innovation, and productivity gains have different effects in society than inflation of asset prices. The former finds equilibrium within the strata of society. The latter further stratifies society.
For roughly the past 40 years, many have paid lip service to the mounting government debt. However, as asset prices continue to rise alongside the astronomical figures describing the government debt burden, the vast majority of professionals and investors feel comfort with their extent of concern limited to lip service as they truly feel the cost of this debt has not been realized within society.
Many of the truths we cling to depend greatly on our own point of view. Let me show you a perspective that just might help shape your view.
Let us first define the wealth of a nation as a measurement of its citizens’ ability to afford quality choices. This definition has been widely understood in academic circles since at least the time Smith wrote his masterpiece of a similar name in 1776. This view doesn’t look at money in the treasury or exports minus imports as the measurement of wealth for a nation. It takes into account the quality of life that the broad citizenry can afford. By this measurement, the United States has had much wealth compared to other nations.
The issue with this definition, and perhaps by design, there isn’t a public index or measurement that simply quantifies this definition in a way that we can track in order to measure the true cost of public debt throughout society.
The most robust method is to construct a composite index that quantifies both purchasing power for quality goods/services and the breadth of meaningful consumer choices accessible across the population. A single measure like GDP per capita or even median income is insufficient. Affordability, quality, and choice diversity all matter, and each dimension has unique drivers and limitations.
With this data lacking in the marketplace, I felt I should create a table that illustrates this cost to society over the past 40 years. This time period coincides with the explosion of public indebtedness our representatives have burdened us with during the past four decades. We’ll call this index the “Wealth Though Choice Index” (WTCI).
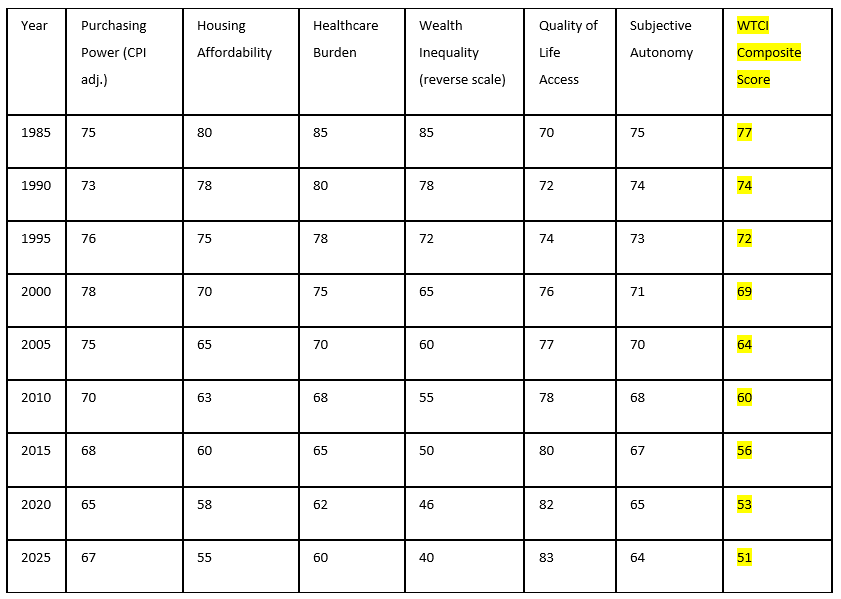
For those that just want the results, the table is presented first. For those that want the methodology, I break it down after the results.

With these results, one can easily see that we lost roughly 34% of the wealth of our nation during the time our public debt has ballooned. This is illustrated with the Wealth Through Choice Index, from 77 in 1985 to 51 in 2025 WTCI score. The cost to society is felt by citizens on both the left and right of the political aisle. However, both sides continue to flood the marketplace with new amounts of US Treasuries. Perhaps our representatives just lack a fresh point of view.
Below you will find the methodology in constructing this index.
Key Components for a Wealth Through Choice Index
Purchasing Power Adjusted for Quality
Purchasing power measured not just against general goods but focused on quality categories: nutritious food, durable goods, energy, health care, reliable transportation, and advanced education. Utilize cost-of-living indices and purchasing power parity benchmarks, corrected quality standards available to at least the median household.
Affordability Metrics Across Life Domains
Specific affordability indices: housing affordability (the share of income needed for median-quality housing), health care affordability, access to quality education, and discretionary spending capacity for leisure and cultural goods. Indices like the Housing Affordability Index or health care burden as a percent of median income are instructive, but must be examined together.
Accessibility to Quality Choice
Quantify the diversity and actual accessibility of quality options. Factors include the geographic distribution of services (e.g., are quality schools, hospitals, or fresh food choices practically within reach for most citizens), and inequalities in access due to wealth gaps or regional disparities. Use metrics from the OECD Better Life Index and the Social Progress Index for comparative insight.
Resilience and Sustainability of Choices
Evaluate whether citizens can consistently afford quality choices in the face of economic shocks, by referencing volatility in affordability indices and savings rates. Resilience is a crucial dimension of meaningful “choice”.
Subjective Well-Being and Perceived Autonomy
Consider survey-based data capturing how free and empowered citizens feel to make quality choices in life domains, supplementing objective metrics. These are used in the OECD Better Life Index and comparable quality-of-life surveys.
The Wealth Through Choice Index (WTCI)
A multi-factor index for a nation includes:
- Median household real purchasing power for baskets of high-quality goods/services
- Share of income needed for core life domains (housing, healthcare, education, transport), weighted by quality tiers
- Quantitative availability of quality goods/services (e.g., number of hospitals rated “excellent” per 100,000 people, access to fresh food outlets)
- Inequality coefficients adjusting for disparities (e.g., Gini for access to quality health/education)
- Survey scores for perceived choice autonomy
There is no single economic or quality-of-life statistic that captures both ability and access to choose quality in all essential areas. For example, high average income may mask widespread inaccessibility to healthcare or housing if those sectors are highly unequal or expensive.
Data Sources Used
- Bureau of Labor Statistics (real incomes, CPI, affordability trends)
- OECD, UN, World Bank well-being and social progress indices for quality-of-life and inclusivity
- National statistical agencies (median wage/price ratios, regional infrastructure, quality scores)
- Large-scale household survey platforms for subjective well-being
A truly rigorous national “wealth through choice” index synthesizes purchasing power for quality, actual breadth/accessibility of choice, and inequality in that access, using both hard economics and human survey insight.
Here are key relevant data series and their approximate historical contexts from 1985 to 2025:
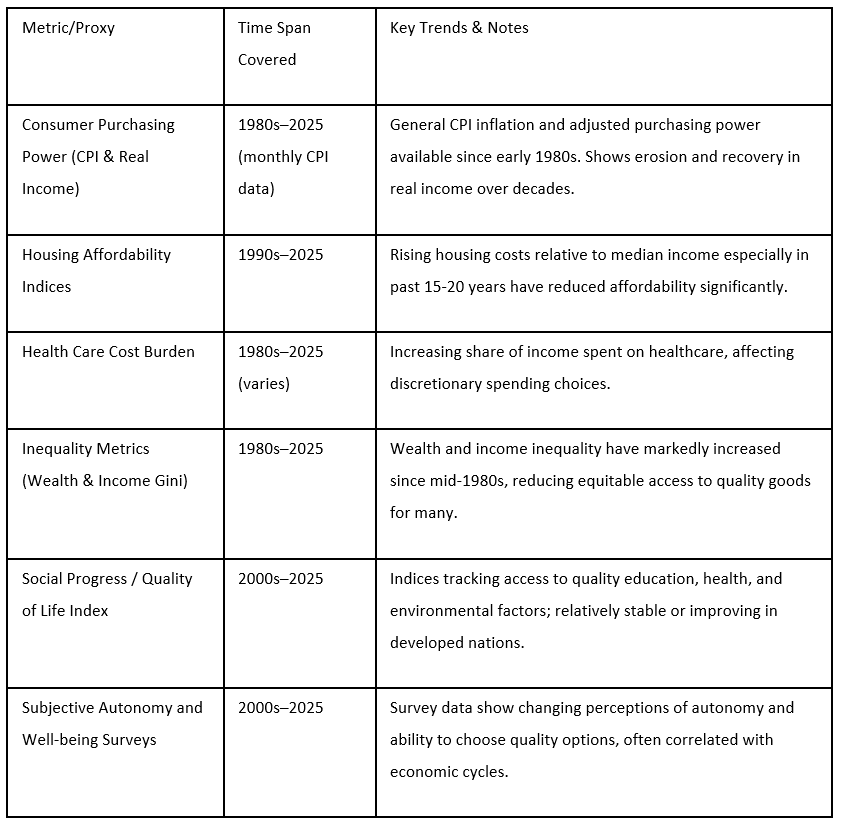
This index reflects declining affordability of quality options over time, driven by rising housing and healthcare costs plus increasing wealth inequality, partially offset by improved social progress and subjective well-being scores. It offers a nuanced measure of national wealth through citizens’ ability to afford and access quality choices beyond GDP alone. The index shows:
- Modest improvement in purchasing power corrected for inflation, but with volatility in the early 1980s and 2008 crisis periods.
- Significant worsening in housing affordability since the early 2000s.
- Rising healthcare costs consuming greater income shares.
- A widening wealth and income gap reducing equitable distribution of purchasing power.
- Mixed to modestly improving access to public services and quality of life metrics.
- Fluctuating subjective autonomy of citizens influenced by economic and social conditions.
Step 1: Data Components Selected
- Purchasing Power (Real Income & Inflation): CPI-U data adjusted for inflation shifts yearly to create a baseline purchasing power measure.
- Housing Affordability Proxy: Median income to median housing cost ratio trend (higher ratio = better affordability).
- Health Care Cost Burden Proxy: Estimated share of median income spent on healthcare over time.
- Wealth Inequality: Top 1% share of net worth to indicate inequality impact on overall affordability and choice.
- Quality of Life & Access Proxy: OECD Better Life Index or Social Progress Index trend to capture non-income access to quality choices.
- Subjective Autonomy & Well-being: Survey-based scores from OECD surveys (normalized).
Step 2: Synthesis Methodology
- Normalize each metric on a 0–100 scale, where 100 represents the best conditions for affordability and quality choice (e.g., highest purchasing power, lowest inequality).
- Combine them with weights reflecting significance:
- Purchasing Power: 30%
- Housing Affordability: 20%
- Healthcare Burden: 15%
- Wealth Inequality: 15%
- Quality of Life Access: 10%
- Subjective Autonomy: 10%
Step 3: Charted Index Trend (1985–2025)
https://www.investopedia.com/terms/a/affordability-index.asp
https://www.oecd.org/en/data/tools/oecd-better-life-index.html
https://ec.europa.eu/eurostat/statistics-explained/index.php/Quality_of_life_indicators_-_measuring_quality_of_life
https://www.bls.gov/cpi/factsheets/purchasing-power-constant-dollars.htm
https://en.wikipedia.org/wiki/Purchasing_power_parity
https://www.numbeo.com/quality-of-life/rankings_by_country.jsp?title=2020&displayColumn=1
https://www.nar.realtor/research-and-statistics/housing-statistics/housing-affordability-index
https://www.atlantafed.org/research/data-and-tools/home-ownership-affordability-monitor
https://www.jchs.harvard.edu/sites/default/files/Harvard_JCHS_Herbert_Hermann_McCue_measuring_housing_affordability.pdf
https://www.socialprogress.org/social-progress-index
https://www.weforum.org/stories/2018/01/how-s-life-where-you-are/
https://apps.urban.org/features/wealth-inequality-charts/
https://unctadstat.unctad.org/datacentre/reportInfo/US.InclusiveGrowth
https://www.bea.gov/data/prices-inflation/gross-domestic-purchases-price-index
https://www.jpmorganchase.com/institute/all-topics/community-development/the-affordability-gap-is-home-ownership-still-within-reach-in-todays-economy
https://www.nar.realtor/research-and-statistics/housing-statistics/housing-affordability-index/methodology
https://www.pewresearch.org/short-reads/2022/03/23/key-facts-about-housing-affordability-in-the-u-s/
https://www.investopedia.com/terms/p/purchasingpower.asp
https://www.sciencedirect.com/science/article/abs/pii/S1040619018301489
https://www.freddiemac.com/research/insight/20241112-the-decline-in-relative-housing-affordability
https://www.calculatorsoup.com/calculators/financial/inflation-calculator.php
https://www.bls.gov/cpi/factsheets/purchasing-power-constant-dollars.htm
https://www.nar.realtor/research-and-statistics/housing-statistics/housing-affordability-index
https://www.atlantafed.org/research/data-and-tools/home-ownership-affordability-monitor
https://www.freddiemac.com/research/insight/20241112-the-decline-in-relative-housing-affordability
https://www.investopedia.com/terms/a/affordability-index.asp
https://ec.europa.eu/eurostat/statistics-explained/index.php/Quality_of_life_indicators_-_measuring_quality_of_life
https://www.journals.uchicago.edu/doi/full/10.1086/712332
https://inequality.org/facts/income-inequality/
https://www.oecd.org/en/data/tools/oecd-better-life-index.html
https://www.socialprogress.org/social-progress-index
https://themeasureofaplan.com/investment-returns-by-asset-class/
https://fred.stlouisfed.org/series/WFRBST01134
https://www.statista.com/statistics/1376622/wealth-distribution-for-the-us-generation/
https://fred.stlouisfed.org/series/BOGZ1FL192090005Q
https://accuratecalculators.com/historical-investment-calculator
https://smartasset.com/investing/inflation-calculator
Latest articles

This data feed is not available at this time.
Data is currently not available