
January Highlights
- China has over $120B in outflows in January as sovereign wealth funds sell to cool markets.
- Industrial metals catch the eye of retail investors in the US.
- Small cap ETFs are beginning to outperform large caps.
The State of the Market
If there’s any truth to the adage “As January goes, so goes the year,” then 2026 should be one to watch for the ETF market. Overall global fund flows picked up where they left off in December, albeit not with the same fury to end the year. While January tends to be a slow month historically, this year started off with a bang, as global ETPs gathered over $135 billion in net inflow, second highest monthly total ever to start the year. Equity flows skewed towards international (minus the outsize outflows in China), natural resources and industrials alongside fixed income funds gathering their steady share.

The result for US listed funds was even better, as they gained a January-record $159 billion last month. Looking under the hood of the US listed fund flow, we can see investor demand spread out across various exposure. Funds with international exposure continue to see flows as they pulled in nearly a third of the inflows for the month, despite accounting for less that 15% of AUM. January’s flows followed a record year in 2025 for international equities amid strong performance . The biggest jump was the increase for EM equity funds, that category had an impressive 5% organic growth for the month. As the concentration risk in the US market remains persistent, US investors look to shift their focus internationally, amid strong outperformance in global markets.

Cashflow into ETPs outside of the US and China has been on an incredible pace over the last 18 months. January’s haul of $96 billion was not only a monthly record, it also pushed the rolling three-month inflows for ex-US/China to over $200 billion, more than double the quarterly average over the last four years. As always, flows are following performance as returns have been boosted by easing inflation pressures, a weaker US dollar, multiple fiscal impulses, improving earnings, and attractive starting valuations.
Autocall Expansion

Over the past three quarters autocallable products have begun to gather assets in the ETF market. Autocallable strategies deliver high income with partial downside protection. As long as the underlying index or exposure remains above a predetermined barrier level investors will continue to get income payments. If the value falls below that level the investors interest payments and principal are at risk. To combat the risk of principal loss ETF issuers are creating laddered products with multiple autocallable notes - sometimes on a weekly basis. Additionally, using a volatility controlled index as the underlying can lead to lower risk of loss as the indexes’ volatility is standardized. Single stock ETF issuers have begun to file for autocallable products and the category is receiving increasing interest from ETF issuers seeking high income solutions for investors.
Small Cap’s Starting to Shine
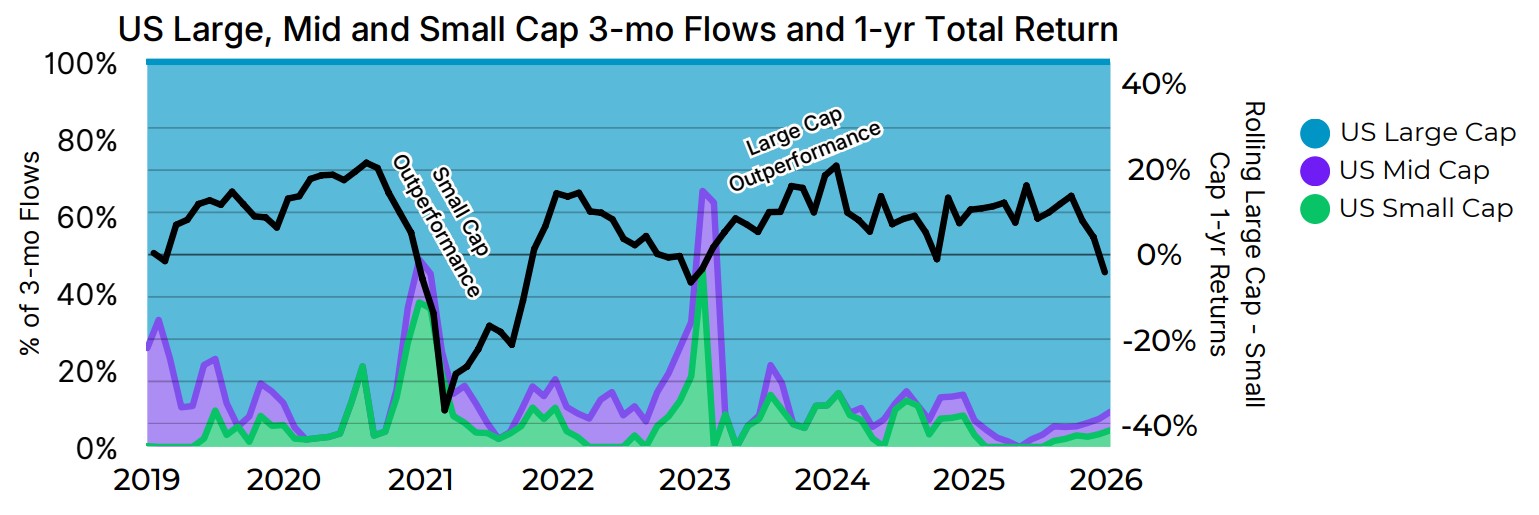
In 2025, large cap funds dominated in flows and performance. The trend has begun to reverse in January. The delta between one year large and small cap US performance is negative for the first time since November ‘24 and at the lowest level since the beginning of 2023. Interestingly, unlike the low point in 2023, flows have not yet followed performance and investors’ funds are still flowing heavily into large cap funds. Small cap funds returns have tailwinds from the Federal Reserve beginning to cut rates late in 2025 and the run of outperformance (and resulting high P/E multiples) of large cap over the past two years. However, the enduring outperformance of US large cap and large investments into AI may make investors hesitate before rotating their portfolios into small cap funds.
The U.S. Retail Report
Net buying activity among retail investors in the US hit continues to grow into the new year. January’s frenzy was driven by the resurgence in thematic exposure funds, one that started to pick up steam midway through last year and does not show any sign of slowing down. Thematic funds accounted for nearly a third of all retail net buying for the month, at the expense of broad beta exposure funds, which continue to lose their share of net buying among retail investors.

Unsurprisingly, physical world funds carried the majority of net buying activity among the thematic cohort. Due to the ongoing macroeconomic uncertainty around the global economy, speculation on industrial demand, and the dollar weakening, real assets such as gold and silver prices keep testing their high-water mark seemingly every month. And as such, retail investors continue to allocate sizeable positions to these products. Silver experienced increased volatility, which led to significant outflows among investors in the broader ETP market, but retail investors continued to buy the dip, as nearly 25% of the net buying for thematic funds went to silver exposure products.

Although demand for gold is returning to its levels before the November sell off, a new metal has started to catch on with the retail investors. Industrial metal funds in the US, particularly those with exposure to copper, had an organic growth of over 46% in January, the largest among all categories in the broader ETP market. Retail investors are following suit as well, though not to the same extent as institutional investors. Their allocation to copper funds in particular increased to nearly 300% from the previous month. Due to the longer-term scarcity premium effect and the “copper rush” from fear of import tariffs, retail net buying of copper exposure funds jumped from $73M in Dec 2025 to $290M in Jan 2026 and the January figure was higher than all of its combined net buying over the last five years. As the retail crowd is known to follow the trend in broader market, it will be interesting to see if they jump on the copper trade and keep increasing their share of net buying.

New Kids on the Block

US Launch and Filing Trends

US launches are showing no sign of slowing down. There were 74 new launches, up 17% from January of last year. Single stock funds still remain ascendant. A third of all funds launched in January were single stock funds. Of those 25 funds all were pure 2x exposure with no single stock funds launched using options this month.
AXS was the most prolific issuer of new products. They launched eleven 2x single stock products including the Tradr 2X Short APLD Daily ETF (APLZ), which provides 2x exposure to Applied Digital Corp, and the Tradr 2X Long ONDS Daily ETF (ONDU), which provides 2x exposure to Ondas. Themes ETFs launched eight 2x products. Single stock products are still primarily providing exposure to high volatility technology securities
Multi-asset products holding bitcoin and more traditional asset classes have continued to launch. Quantify Funds launched to return stacked funds. IncomeSTKd 1x US Stocks & 1x Bitcoin Premium ETF (ISSB) provides 100% exposure to both equities and bitcoin. The IncomeSTKd 1x Bitcoin & 1x Gold Premium ETF (ISBG) does the same but with exposure to bitcoin and gold. CyberHornet launched the Cyber Hornet S&P 500 and Solana 75/25 Strategy ETF (SSS) holding the S&P 500 and Solana in a fixed allocation multi-asset portfolio.
There were 263 new filings this month. 43% of them were from Corgi ETFs exploding onto the scene with 113 filings. They primarily filed for a combination of leveraged sector and thematic funds as well as buffer strategies. Calamos filed for another autocallable ETF focusing on growth opportunities.
International Lens The Resurgence of ‘Buy Europe’
Since 2024 there have been volatile swings in European buying. coming out of the 2024 election cycle the sentiment was bullish. European investors were pouring into funds investing in the United States. However, with the threats and roll outs of tariffs, the exuberance faded and the delta between European investments into the United States and Europe hit the lowest level this decade. The delta recovered in the second half of the year with European investors preferring to invest in the U.S.

As 2026 begins, European investors are once again becoming apprehensive of investing in U.S. based securities. The threats to Greenland and renewed tariff worries are rehashing the beginning of the second quarter of 2025. January 2026 is the largest negative delta ever in January. Investors tend to move more slowly in January as they determine their goals and risk tolerance for the year. The decisive move into prioritizing European-based buying bodes well for flows into European funds. If international funds continue to outperform the United States and investors remain uncertain about the prevailing direction of the United States the trend will likely continue.
State Sponsored Outflows from China

China's state-backed funds have fundamentally transformed their market role in 2026, shifting from one-way support to active two-way intervention. Central Huijin Investment sold US$67.5 billion across 14 ETFs in just six trading sessions, marking a dramatic pivot toward cooling speculative rallies rather than merely cushioning downturns. This strategy targets a stable "slow bull" market that bolsters economic confidence and channels capital to priority tech sectors while preventing bubble-driven volatility, with selling concentrated in overheated areas like semiconductors and AI. The approach is already reshaping market behavior—traders now track ETF turnover spikes as intervention signals, and some fund managers avoid heavily state-owned stocks. Combined with tighter margin financing rules, the intervention has successfully reduced CSI 300 volatility to its lowest since May 2025.


Latest articles

This data feed is not available at this time.
Data is currently not available