
2025 Highlights
- Yearly global cash flow into ETPs hit a new record passing $2T for the first time.
- New ETP launches hit an all time high with nearly 2700 fund launches; 85% of all US new products were active and 27% were single stock funds.
- In 2025 retail trading activity increased 39% driven by dip buying and fixed income ETPs
The State of the Market
Amidst the backdrop of an ever present threat of a full-scale global trade war, sticky inflation that led to policy uncertainty and the longest US federal government shutdown ever, financial markets delivered exceptional performance globally in 2025. All three major asset classes – equities, fixed income, and commodities – not only delivered positive returns, but each also outperformed cash for the first time since 2019. The broad-based gains reflected strong investor sentiment and resilient market conditions worldwide despite the political headwinds. ETPs globally saw record inflows of over $2.2T in 2025, easily surpassing the previous year's high of $1.7T. December alone brought in an unprecedented $322.2B, the industry's first month with over $300B in inflows. Risk-on sentiment, acceleration of secular trends such as low-cost and active, and typical seasonal buying all contributed significantly to this strong finish for 2025. After a dip in cashflows in the first half of 2025 due to the tariff correction and apprehension about long term market conditions, they returned with a vengeance at the second half of the year. The fourth quarter hit a new quarterly record with $542B in global inflows as strength was seen across the board.

Despite fixed income funds’ record haul in 2025, sentiment isn’t screaming defensive. The rolling three-month cashflow difference between equity and bond ETPs is just below the all-time high (December 2024), clearly indicating bullish risk-on sentiment among investors. From a geographic perspective, a year after the US accounted for 68% of all equity flows, their share fell to just over 53% in 2025. As international markets outperformed the US, investors chased returns and sought to increase regional diversification within their equity allocations.

The Rise of Active
Active ETF launches, as defined by traditional active/passive delineations, have drastically increased over the past decade from almost nonexistent to almost 85% of all US launches in 2025. However, by limiting categorization to the binary distinction between active and passive, truly actively managed, stock picking funds with manager discretion get lumped in with funds that may not track an index but are heavily systematic. A fund that aims to get 2x leverage on NVDA is technically active but is closer in spirit to a systematic index tracking fund like QQQ. Similarly, many option overlay products follow systematic strategies to achieve their objective.

We have split active into two categories to reflect this distinction. Systematic active funds are funds that don’t track an index but follow a system or rules and restrictions to select and weight their holdings. Discretionary active funds have manager discretion in deciding what goes into a fund. They may have minimal restrictions in terms of theme, geographic or factor exposure but how that exposure is achieved is largely up to the PM. While active launches have drastically increased that growth is entirely coming from systematic active funds as opposed to discretionary active. Flows tell a different story with discretionary active funds and systematic active each gathering 15% and 16% of flows in 2025 respectively. However, looking at equity funds discretionary pulled in only 9% while systematic got 21% of flows in 2025. Discretionary active was most popular within fixed income taking 30% of inflows in 2025.
Precious Metal Rally

Precious metals had an incredible 2025. A confluence of factors including increasing global uncertainty, increased demand in industrial applications, and US fed rate cuts have led to precious metals skyrocketing in value. Demand for precious metal ETPs soared. When looking at ETP flows it is clear that gold dominates the conversation with silver starting to take an increasing though still significantly smaller portion of flows. The other precious metals have seen increased interest but their piece of the overall pie is still miniscule. Interest remains strong heading into 2026 with $26.4B in flows in December as demand for real hard assets continues to rise.
US ETP Threads | Ranked Launches and Filings by Nasdaq Taxonomy

US Launch Trends
2025 was a banner year for ETPs with not just record breaking flows, but also with launches, filings. This year was the year of income generation, predominantly through the use of derivatives and sometimes at the expense of investors’ principal. Launches and filings were bolstered by single stock funds. Single stock fund issuers and other newer entrants saw the success of funds like JEPQ, QQQI and other high income funds and decided to throw their hat in the ring. The majority of single stock launches are using total return swaps with leverage applied but there are more enhanced income single stock products being launched with covered calls. The crypto market diversified from the ‘blue chips’ and the SEC allowed launches for spot funds from Solana to Dogecoin. While it’s nearly impossible to recreate the initial flows into cryptocurrency as a new ETP asset class (i.e. IBIT) from funds launched this year, the continued inflows and varied launches speak to the stickiness of the newcomer even as the overall asset class saw a down year. Private credit funds have gained traction starting with the launch of SPDR SSGA IG Public & Private Credit ETF (PRIV) in April which now has $94M AUM after a slower start. Five new private credit launches have followed over this year.

Continuing on the year’s trend to maximize income, fixed income, particularly money market funds had a great 2025. New fixed income ETPs gathered 36% of all flows into new ETPs versus 6% in 2024. With interest rates expected to fall further and low growth predictions for equities in the next decade investors are seeking alternative investment and providers have launched a wave of active fixed income to meet the rising demand.
The Retail Report
Economic events in 2025 created a recordbreaking year for ETP retail activity, characterized by a 39% increase in retail trading compared to 2024. July and December saw the highest month-over-month increase in 2025 as investors navigated AI-driven market volatility, tariff-induced turbulence, and Federal Reserve rate cuts, driven by a "dip-buying" mentality, with retail investors heavily favoring active ETPs and thematic strategies. With the record number of ETPs launching in 2025 offering a myriad of options, retail investors took advantage of the active ETPs that came to market while also piling into commodities, led by gold, silver and copper. Equity market funds remained the dominant destination for retail investors’ capital, with a significant portion flowing into U.S. equity while ETFs with European exposure such Vanguard FTSE Europe (VGK) helped push EMEA’s normalized net buying close to its U.S. counterpart by the end of 2025.

Share of Net Buying Activity of New Funds in their Respective Launch Year
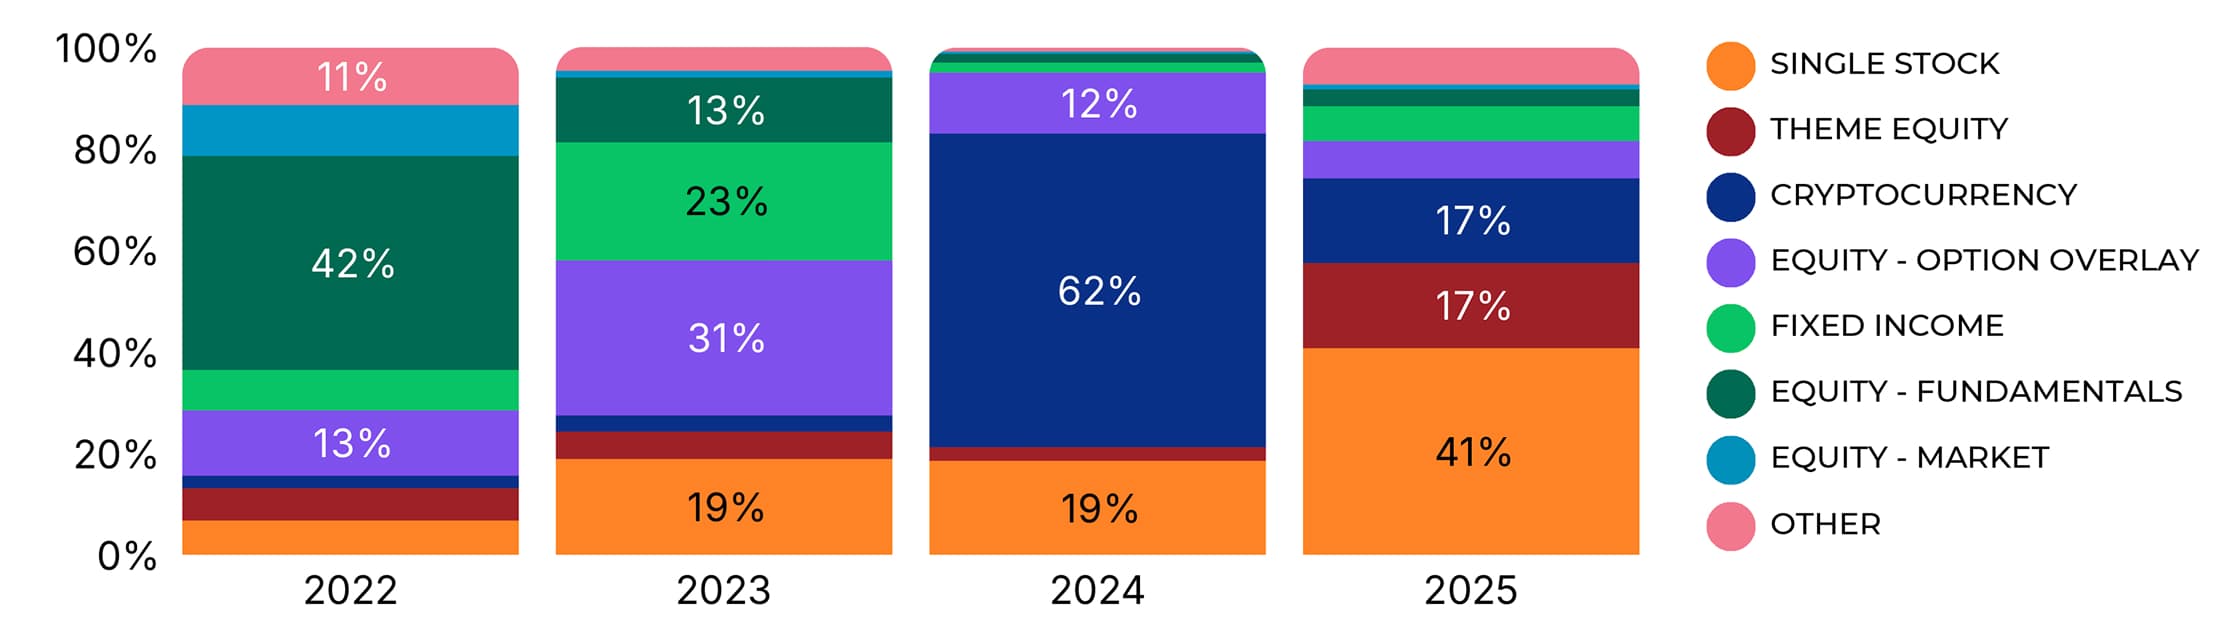
Focusing on net buying of funds that were launched over the last four years, there was a consistent theme of retail investors targeting different ETFs each year based on market conditions and product demand. For 2025 launches, over 40% of net buying was focused on new single stock funds that sought enhanced income and leveraged tech companies, with Roundhill HOOD Weekly Pay (HOOW) and T-Rex 2x Long BMNR Daily Target (BMNU) leading the way. New funds launched in 2024 told a different story with cryptocurrency ETFs gathering almost two-thirds of retail net buying that year, mainly driven by the long-awaited arrival of iShares Bitcoin Trust (IBIT) and Fidelity Wise Origin Bitcoin (FBTC) with $1.8B and $1.3B in net buying, respectively. Retail investors desire to generate high income and mitigate portfolio volatility helped push equity - option overlay ETFs to 31% of net buying of new funds launched in 2023, with Defiance Nasdaq 100 Weekly Distribution (QQQY) leading the charge.
International Lens
Regional Rotation Whiplash

Trade-policy headlines drove a sharp rotation away from U.S. exposure ETPs in 2025. The shift began early in the year as Europe's renewed commitment to defense and infrastructure spending drew investor interest. Defense-themed ETPs emerged as the most popular thematic play during this period. The U.S. share of 3-month rolling global ETP cashflow peaked at 90% in January, then plunged to 36% by July as the "Sell America" trade accelerated following Liberation Day tariff announcements. EMEA and Global exposure ETPs were the primary beneficiaries, with EMEA climbing to ~15% and Global ETPs peaking at ~63% of flows. By year-end, U.S. allocations recovered back to ~63-70% as trade tensions eased, though remained below January's peak.

APAC ETPs’ total AUM has reached $2.3T, doubling from $1T to $2T in just four years. This rapid expansion underscores the region’s strong growth momentum and significant market opportunity. In 2025, APAC recorded over $223B of inflows, representing approximately 15% organic growth— another record-breaking year for the region. The largest contributions came from China ($129B - 58% of the region’s total flow) and followed by South Korea ($57B) and Australia ($29B). China officially overtook Japan to become the largest ETF market in APAC with AUM crossing $800B. South Korea’s 50% organic growth rate is equally remarkable, particularly given its smaller starting asset base in 2024 as the region’s fourth-largest ETF market. Australia continued to experience strong and steady inflows, supported by its well‑established and mature ETF market structure.


Latest articles

This data feed is not available at this time.
Data is currently not available