
CDW Corporation (CDW) reported third-quarter 2025 non-GAAP earnings per share (EPS) of $2.71, surpassing the Zacks Consensus Estimate of $2.53. Also, the bottom line increased 3% year over year.
The company’s revenues increased 4% year over year to $5.74 billion. On a constant currency (cc) basis, sales grew 3.8%, showing broad-based demand across product categories, such as notebooks/mobile devices, software, networking (netcomm) products, desktops and services, despite a slowdown in data storage and servers. Despite ongoing macroeconomic uncertainty, some end markets showed signs of improved customer spending during the quarter. Quarterly revenues also exceeded the consensus estimate of $5.7 billion.
Looking ahead, CDW reaffirmed its goal to outpace the U.S. IT market growth by 200–300 basis points at cc.
Separately, the company announced a quarterly dividend of 63 cents, to be paid on Dec. 10, 2025, to shareholders on record as of Nov. 25, reflecting a 1% increase year over year.
CDW Corporation Price, Consensus and EPS Surprise

CDW Corporation price-consensus-eps-surprise-chart | CDW Corporation Quote
In the past year, shares have declined 19% compared with the Zacks Computers-IT Services industry’s fall of 11.5%.
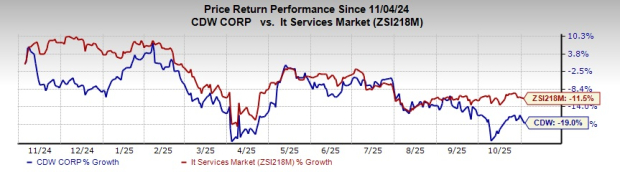
Image Source: Zacks Investment Research
Segmental Details
Net sales of CDW’s Corporate segment amounted to $2.25 billion, growing 4.4% on a year-over-year basis.
The Small Business segment’s net sales of $434 million rose 14.2% year over year.
The Public segment’s revenues totaled $2.35 billion, up 0.6% from the year-ago quarter. The uptick was driven by a 7.8% and 6.9% surge in net sales of Government customers and Healthcare customers, respectively, offset by an 8.5% decline in the Education sector.
Net sales in Other (Canadian and U.K. operations) rose 9.1% to $698 million.
Margin Details
Gross profit grew 4.6% year over year to $1.26 billion. Gross profit margin rose slightly to 21.9% from 21.8%, driven by higher service rates and more netted-down revenue.
The non-GAAP operating income fell 0.6% year over year to $530.6 million. The non-GAAP operating margin was down to 9.2% from 9.7%.
Selling and administrative expenses surged 12.9% year over year to $812 million due to higher performance-based pay, transformation costs and amortization of acquired intangibles.
Balance Sheet and Cash Flow
As of Sept. 30, 2025, CDW had $452.9 million of cash and cash equivalents compared with $946.7 million a year ago.
The company has a long-term debt of $5.62 billion, higher than $5.6 billion in the previous year.
For the nine months that ended on Sept. 30, 2025, CDW generated $771.4 million of cash flow from operating activities compared with $932 million in the year-ago period. Free cash flow was $692.2 million.
CDW’s Zacks Rank
CDW currently carries a Zacks Rank #3 (Hold). You can see the complete list of today’s Zacks #1 Rank (Strong Buy) stocks here
Recent Performance of Other Companies
Flex Ltd. (FLEX) reported second-quarter fiscal 2026 adjusted EPS of 79 cents, which surpassed the Zacks Consensus Estimate by 5.3%. The bottom line compared favorably with 64 cents posted in the prior-year quarter. Revenues increased 4% year over year to $6.8 billion. Also, it beat the consensus mark by 2%. The uptick was driven by strong data center growth in both the cloud and power end markets, despite a complex macroeconomic environment.
Fortive Corporation (FTV) reported third-quarter 2025 adjusted EPS of 68 cents from continuing operations, which surpassed the Zacks Consensus Estimate of 58 cents. The bottom line increased 15.3% year over year. Revenues increased 2.3% year over year to $1.03 billion. The top line beat the Zacks Consensus Estimate by 2.1%. Core revenues jumped 1.9%.
Sensata Technologies Holding plc (ST) reported third-quarter 2025 adjusted EPS of 89 cents, flat year over year. However, the bottom line topped the Zacks Consensus Estimate by 4.7%. Revenues for the quarter reached $932 million, down 5.2% from a year ago. The top-line contraction was attributable to earlier announced divestitures and product lifecycle optimization efforts. However, the figure outperformed management’s expectations ($900-$930 million) and beat the consensus estimate by 1.9%.
Sensata Technologies Holding N.V. (ST) : Free Stock Analysis Report
Flex Ltd. (FLEX) : Free Stock Analysis Report
CDW Corporation (CDW) : Free Stock Analysis Report
Fortive Corporation (FTV) : Free Stock Analysis Report
This article originally published on Zacks Investment Research (zacks.com).
The views and opinions expressed herein are the views and opinions of the author and do not necessarily reflect those of Nasdaq, Inc.

