
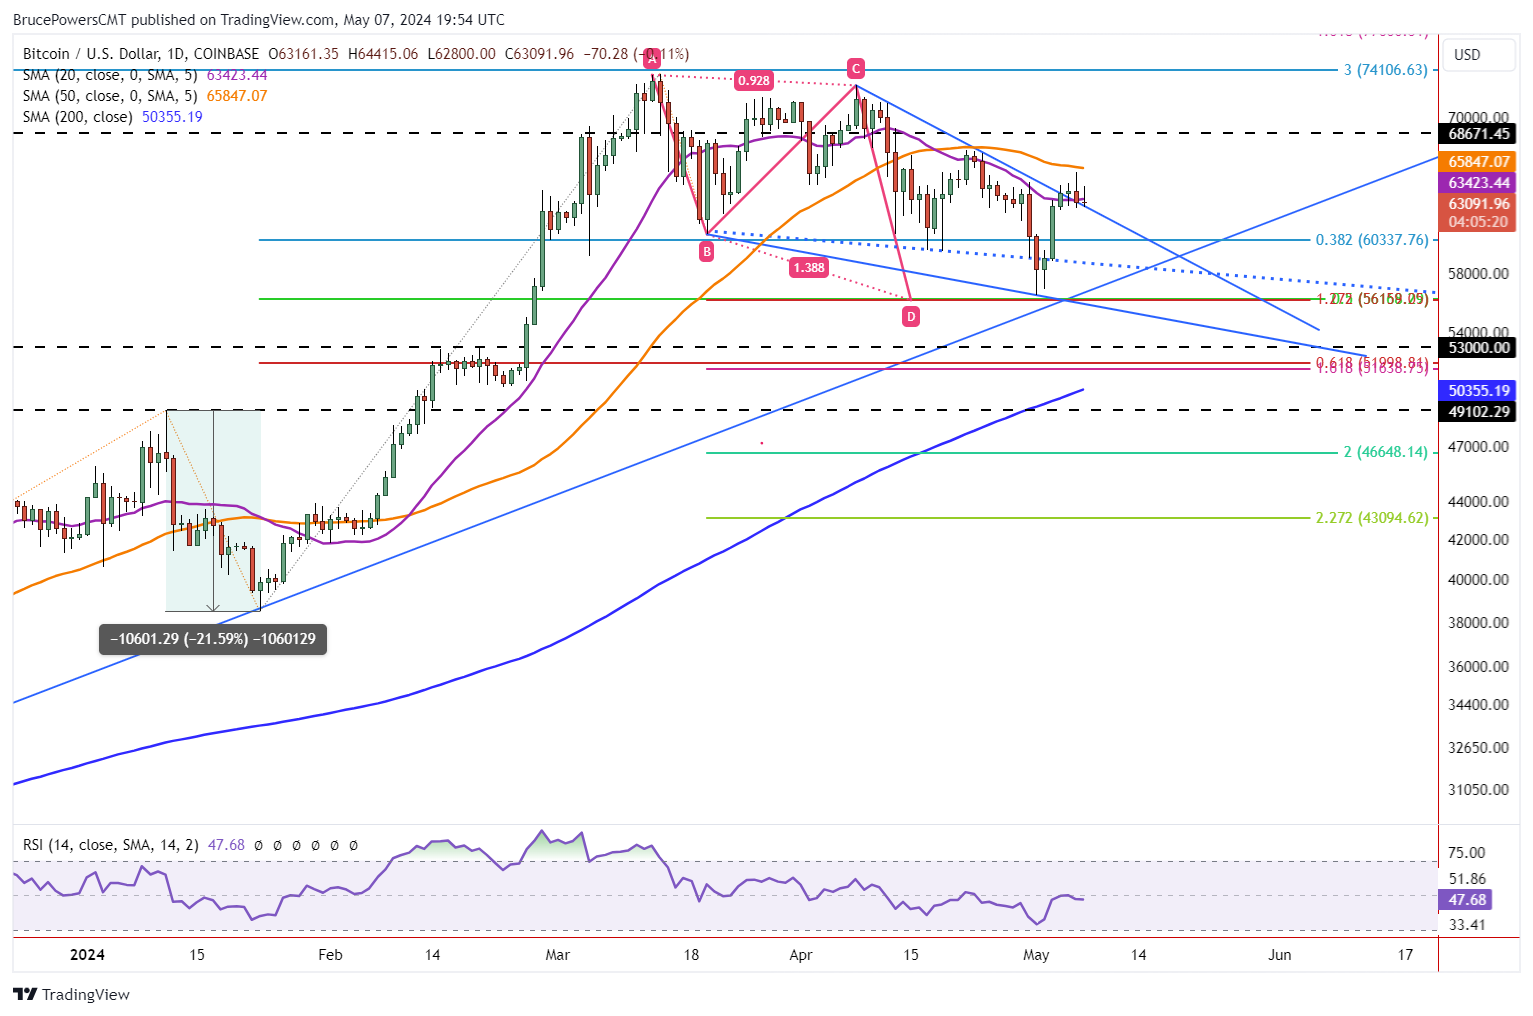
Bitcoin remains in a correction that looks to be getting closer to completion. Last week, Bitcoin triggered a breakdown from a potential bull wedge pattern on a drop below the lower boundary line of the pattern (dotted blue line). Subsequently, it found support at 56,500 and bounced. That low completed two targets, a 50% trend retracement, and the completion of a falling extended ABCD pattern. Last Friday’s bullish reversal from an inside day confirmed the low as it wasn’t clear it would be a swing low until then.
20-Day Moving Average Recaptured
The subsequent rally off last week’s low reached a high of 65,523 on Monday. Bitcoin recaptured both the purple 20-Day MA and internal downtrend line that marks the top of a bull wedge during the advance, reflecting strength. Resistance is still being seen at the orange 50-Day MA.
Once last week’s low was established it became clear that the prior bull wedge pattern had expanded to incorporate last week’s low. It is interesting to note that an upside breakout of the wedge triggered on Saturday while the 20-Day line was broken to the upside, proving a second piece of evidence for a bullish breakout. However, what happens next is key.
Holding Above Prior Resistance
Since Saturday, Bitcoin has been largely holding above support (prior resistance) of the downtrend line and 20-Day MA. There has been little confirmation by the market that a bullish breakout of a wedge has been triggered. It puts the pattern at risk of failure unless upside momentum kicks in soon. If Bitcoin can remain above the downtrend line and top of wedge it will continue to have a chance for further strengthening.
Bullish Breakout Triggers Above 65,523
A breakout above 65,523 shows strength, and further still on a rally above the prior swing high at 67,226. Also, the relationship to the 50-Day MA at 65,848 is key. If last week’s is exceeded to the upside the 50-Day line will be waiting. Therefore, an advance above the 50-Da line, followed by a daily close above it, will be needed for signs of strength that may be sustainable and lead to new record highs for Bitcoin. Of course, a drop below last week’s low is a sign of weakness and could be followed by a deeper retracement.
For a look at all of today’s economic events, check out our economic calendar.
This article was originally posted on FX Empire
More From FXEMPIRE:
- How Will The 2024 Elections Affect Your Investments? Octa Analysis
- Crude Inventories Decline By 1.4 Million Barrels
- EUR/USD, GBP/USD, USD/CAD, USD/JPY Forecasts – U.S. Dollar Gains Some Ground In Choppy Trading
The views and opinions expressed herein are the views and opinions of the author and do not necessarily reflect those of Nasdaq, Inc.

