
Axon Enterprise, Inc. AXON has been grappling with rising costs and expenses over time. AXON reported an uptick in costs and expenses during the first quarter of 2025. The company’s cost of sales rose 18.2% year over year in the first quarter. The metric surged 39% year over year in 2024. AXON’s selling, general and administrative (SG&A) expenses also increased 48% year over year in the first quarter. The same rose 49.8% year over year in 2024. Key factors behind the company’s high costs and SG&A expenses included business integration activities, increased headcount, higher wages and stock-based compensation expense.
Despite the rising costs, in the first quarter, AXON’s adjusted gross margin increased 40 basis points to 63.6%. Also, its adjusted EBITDA margin increased to 25.7% from 23.7% in the year-ago period. The improvement in margins was driven by higher revenues generated from robust sales for TASER 10, Axon Body 4 and platform sensor products. The company reported revenues of $603.6 million in the quarter, which increased 31.3% year over year.
Axon Enterprise’s focus on effective cost management and revenue improvement is likely to expand its margin performance. For 2025, AXON expects adjusted EBITDA in the range of $650-$675 million, implying an adjusted EBITDA margin of approximately 25%.
It's worth noting that, effective first-quarter 2025, Axon Enterprise realigned its business segments. This realignment is expected to enhance the company’s visibility into segment-specific performance and enable it to effectively manage its costs. This strategic move will likely support Axon Enterprise’s ongoing margin improvement and operational efficiency.
Margin Performance of AXON’s Peers
Among its major peers, Kratos Defense & Security Solutions, Inc. KTOS is facing cost pressure. Its cost of sales increased 11.1% in the first quarter of 2025. Kratos’ SG&A expenses rose 4.8%, year over year in the same period. Kratos’ gross margin declined 30 basis points to 24.3% in the first quarter.
The escalating costs and expenses are also a concern for Teledyne Technologies Incorporated TDY. Teledyne’s cost of sales rose 7.8% year over year in the first quarter of 2025. The company’s SG&A expenses also increased 6.5% year over year. Teledyne’s gross margin declined 320 basis points to 42.7% in the same period.
AXON’s Price Performance, Valuation and Estimates
Shares of Axon Enterprise have surged 181.1% in the past year compared with the industry’s growth of 20.8%.

Image Source: Zacks Investment Research
From a valuation standpoint, AXON is trading at a forward price-to-earnings ratio of 1,195.30X above the industry’s average of 45.34X. Axon carries a Value Score of F.
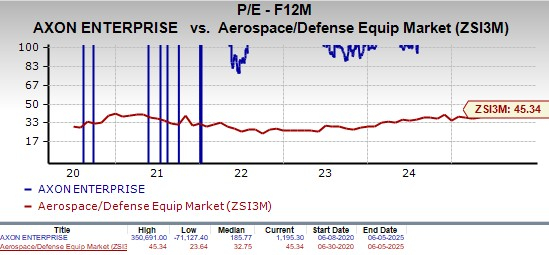
Image Source: Zacks Investment Research
The Zacks Consensus Estimate for AXON’s 2025 earnings has been on the rise over the past 60 days.
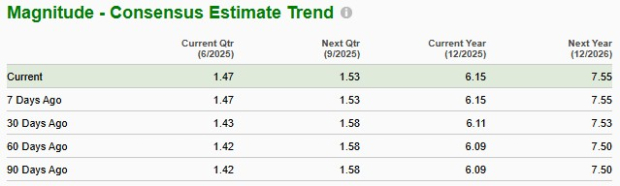
Image Source: Zacks Investment Research
The company currently carries a Zacks Rank #3 (Hold). You can see the complete list of today’s Zacks #1 Rank (Strong Buy) stocks here.
Zacks' Research Chief Names "Stock Most Likely to Double"
Our team of experts has just released the 5 stocks with the greatest probability of gaining +100% or more in the coming months. Of those 5, Director of Research Sheraz Mian highlights the one stock set to climb highest.
This top pick is among the most innovative financial firms. With a fast-growing customer base (already 50+ million) and a diverse set of cutting edge solutions, this stock is poised for big gains. Of course, all our elite picks aren’t winners but this one could far surpass earlier Zacks’ Stocks Set to Double like Nano-X Imaging which shot up +129.6% in little more than 9 months.
Free: See Our Top Stock And 4 Runners UpTeledyne Technologies Incorporated (TDY) : Free Stock Analysis Report
Kratos Defense & Security Solutions, Inc. (KTOS) : Free Stock Analysis Report
Axon Enterprise, Inc (AXON) : Free Stock Analysis Report
This article originally published on Zacks Investment Research (zacks.com).
The views and opinions expressed herein are the views and opinions of the author and do not necessarily reflect those of Nasdaq, Inc.

