
In the last three months, 12 analysts have published ratings on Procter & Gamble (NYSE:PG), offering a diverse range of perspectives from bullish to bearish.
The table below provides a snapshot of their recent ratings, showcasing how sentiments have evolved over the past 30 days and comparing them to the preceding months.
| Bullish | Somewhat Bullish | Indifferent | Somewhat Bearish | Bearish | |
|---|---|---|---|---|---|
| Total Ratings | 4 | 5 | 3 | 0 | 0 |
| Last 30D | 0 | 1 | 0 | 0 | 0 |
| 1M Ago | 0 | 0 | 1 | 0 | 0 |
| 2M Ago | 3 | 4 | 1 | 0 | 0 |
| 3M Ago | 1 | 0 | 1 | 0 | 0 |
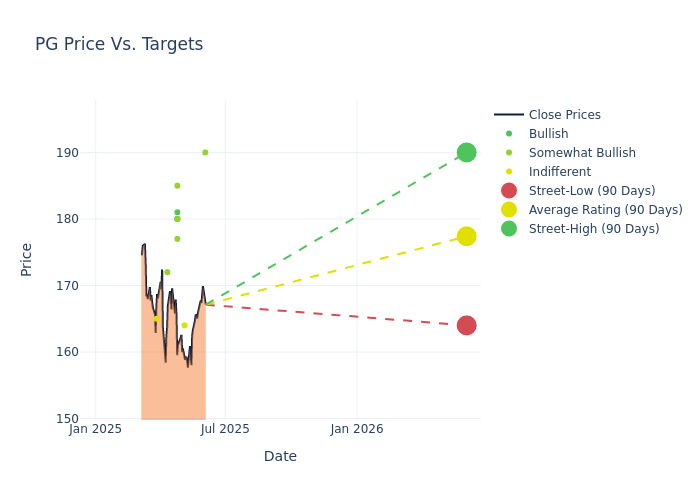
Analysts provide deeper insights through their assessments of 12-month price targets, revealing an average target of $176.92, a high estimate of $190.00, and a low estimate of $164.00. Highlighting a 0.51% decrease, the current average has fallen from the previous average price target of $177.83.
Interpreting Analyst Ratings: A Closer Look
A comprehensive examination of how financial experts perceive Procter & Gamble is derived from recent analyst actions. The following is a detailed summary of key analysts, their recent evaluations, and adjustments to ratings and price targets.
| Analyst | Analyst Firm | Action Taken | Rating | Current Price Target | Prior Price Target |
|---|---|---|---|---|---|
| Robert Ottenstein | Evercore ISI Group | Raises | Outperform | $190.00 | $170.00 |
| Korinne Wolfmeyer | Piper Sandler | Raises | Neutral | $164.00 | $160.00 |
| Nik Modi | RBC Capital | Raises | Outperform | $177.00 | $164.00 |
| Bill Chappell | Truist Securities | Lowers | Buy | $180.00 | $185.00 |
| Olivia Tong | Raymond James | Lowers | Outperform | $185.00 | $190.00 |
| Dara Mohsenian | Morgan Stanley | Lowers | Overweight | $180.00 | $191.00 |
| Filippo Falorni | Citigroup | Lowers | Buy | $181.00 | $200.00 |
| Olivia Tong | B of A Securities | Lowers | Buy | $180.00 | $190.00 |
| Nik Modi | RBC Capital | Maintains | Sector Perform | $164.00 | $164.00 |
| Andrea Teixeira | JP Morgan | Lowers | Overweight | $172.00 | $181.00 |
| Bill Chappell | Truist Securities | Raises | Buy | $185.00 | $180.00 |
| Lauren Lieberman | Barclays | Raises | Equal-Weight | $165.00 | $159.00 |
Key Insights:
- Action Taken: In response to dynamic market conditions and company performance, analysts update their recommendations. Whether they 'Maintain', 'Raise', or 'Lower' their stance, it signifies their reaction to recent developments related to Procter & Gamble. This insight gives a snapshot of analysts' perspectives on the current state of the company.
- Rating: Analysts assign qualitative assessments to stocks, ranging from 'Outperform' to 'Underperform'. These ratings convey the analysts' expectations for the relative performance of Procter & Gamble compared to the broader market.
- Price Targets: Analysts navigate through adjustments in price targets, providing estimates for Procter & Gamble's future value. Comparing current and prior targets offers insights into analysts' evolving expectations.
Considering these analyst evaluations in conjunction with other financial indicators can offer a comprehensive understanding of Procter & Gamble's market position. Stay informed and make well-informed decisions with our Ratings Table.
Stay up to date on Procter & Gamble analyst ratings.
Get to Know Procter & Gamble Better
Since its founding in 1837, Procter & Gamble has become one of the world's largest consumer product manufacturers, with annual sales approaching $85 billion. It operates with a lineup of leading brands, including more than 20 that generate north of $1 billion each in annual global sales, such as Tide laundry detergent, Charmin toilet paper, Pantene shampoo, and Pampers diapers. Sales outside its home turf represent just more than half of the firm's consolidated total.
Procter & Gamble: Financial Performance Dissected
Market Capitalization Highlights: Above the industry average, the company's market capitalization signifies a significant scale, indicating strong confidence and market prominence.
Negative Revenue Trend: Examining Procter & Gamble's financials over 3M reveals challenges. As of 31 March, 2025, the company experienced a decline of approximately -2.07% in revenue growth, reflecting a decrease in top-line earnings. When compared to others in the Consumer Staples sector, the company faces challenges, achieving a growth rate lower than the average among peers.
Net Margin: Procter & Gamble's net margin is impressive, surpassing industry averages. With a net margin of 18.7%, the company demonstrates strong profitability and effective cost management.
Return on Equity (ROE): Procter & Gamble's ROE is below industry standards, pointing towards difficulties in efficiently utilizing equity capital. With an ROE of 7.26%, the company may encounter challenges in delivering satisfactory returns for shareholders.
Return on Assets (ROA): Procter & Gamble's ROA stands out, surpassing industry averages. With an impressive ROA of 3.01%, the company demonstrates effective utilization of assets and strong financial performance.
Debt Management: The company maintains a balanced debt approach with a debt-to-equity ratio below industry norms, standing at 0.66.
The Basics of Analyst Ratings
Within the domain of banking and financial systems, analysts specialize in reporting for specific stocks or defined sectors. Their work involves attending company conference calls and meetings, researching company financial statements, and communicating with insiders to publish "analyst ratings" for stocks. Analysts typically assess and rate each stock once per quarter.
Some analysts publish their predictions for metrics such as growth estimates, earnings, and revenue to provide additional guidance with their ratings. When using analyst ratings, it is important to keep in mind that stock and sector analysts are also human and are only offering their opinions to investors.
Which Stocks Are Analysts Recommending Now?
Benzinga Edge gives you instant access to all major analyst upgrades, downgrades, and price targets. Sort by accuracy, upside potential, and more. Click here to stay ahead of the market.
This article was generated by Benzinga's automated content engine and reviewed by an editor.
Latest Ratings for PG
| Date | Firm | Action | From | To |
|---|---|---|---|---|
| Jun 2025 | Evercore ISI Group | Maintains | Outperform | Outperform |
| May 2025 | Piper Sandler | Maintains | Neutral | Neutral |
| Apr 2025 | RBC Capital | Upgrades | Sector Perform | Outperform |
View More Analyst Ratings for PG
View the Latest Analyst Ratings
© 2025 Benzinga.com. Benzinga does not provide investment advice. All rights reserved.
The views and opinions expressed herein are the views and opinions of the author and do not necessarily reflect those of Nasdaq, Inc.

