
When you buy a stock there is always a possibility that it could drop 100%. But when you pick a company that is really flourishing, you can make more than 100%. For example, the Apollo Global Management, Inc. (NYSE:APO) share price has soared 225% in the last half decade. Most would be very happy with that. On the other hand, the stock price has retraced 4.7% in the last week. But this could be related to the soft market, with stocks selling off around 2.5% in the last week.
While this past week has detracted from the company's five-year return, let's look at the recent trends of the underlying business and see if the gains have been in alignment.
To paraphrase Benjamin Graham: Over the short term the market is a voting machine, but over the long term it's a weighing machine. One flawed but reasonable way to assess how sentiment around a company has changed is to compare the earnings per share (EPS) with the share price.
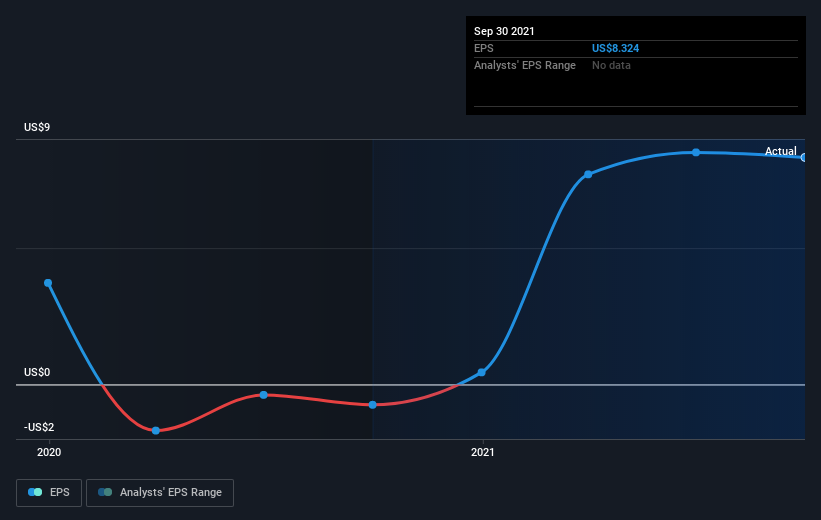
During the last half decade, Apollo Global Management became profitable. That kind of transition can be an inflection point that justifies a strong share price gain, just as we have seen here.
The graphic below depicts how EPS has changed over time (unveil the exact values by clicking on the image).
We know that Apollo Global Management has improved its bottom line lately, but is it going to grow revenue? You could check out this free report showing analyst revenue forecasts.
What about the Total Shareholder Return (TSR)?
We'd be remiss not to mention the difference between Apollo Global Management's total shareholder return (TSR) and its share price return. The TSR attempts to capture the value of dividends (as if they were reinvested) as well as any spin-offs or discounted capital raisings offered to shareholders. Apollo Global Management hasn't been paying dividends, but its TSR of 329% exceeds its share price return of 225%, implying it has either spun-off a business, or raised capital at a discount; thereby providing additional value to shareholders.
A Different Perspective
It's good to see that Apollo Global Management has rewarded shareholders with a total shareholder return of 54% in the last twelve months. Since the one-year TSR is better than the five-year TSR (the latter coming in at 34% per year), it would seem that the stock's performance has improved in recent times. Given the share price momentum remains strong, it might be worth taking a closer look at the stock, lest you miss an opportunity. It's always interesting to track share price performance over the longer term. But to understand Apollo Global Management better, we need to consider many other factors. Even so, be aware that Apollo Global Management is showing 3 warning signs in our investment analysis , and 1 of those doesn't sit too well with us...
But note: Apollo Global Management may not be the best stock to buy. So take a peek at this free list of interesting companies with past earnings growth (and further growth forecast).
Please note, the market returns quoted in this article reflect the market weighted average returns of stocks that currently trade on US exchanges.
Have feedback on this article? Concerned about the content? Get in touch with us directly. Alternatively, email editorial-team (at) simplywallst.com.
This article by Simply Wall St is general in nature. We provide commentary based on historical data and analyst forecasts only using an unbiased methodology and our articles are not intended to be financial advice. It does not constitute a recommendation to buy or sell any stock, and does not take account of your objectives, or your financial situation. We aim to bring you long-term focused analysis driven by fundamental data. Note that our analysis may not factor in the latest price-sensitive company announcements or qualitative material. Simply Wall St has no position in any stocks mentioned.
The views and opinions expressed herein are the views and opinions of the author and do not necessarily reflect those of Nasdaq, Inc.

