
The Bear Flag: A Simple, Yet Powerful Pattern
In the technical analysis realm, a bear flag is a bearish continuation pattern that forms when there is a downtrend in price, followed by a brief rally, and finally a break lower. An excellent example of a bear flag break is the recent US Natural Gas Fund ETF (UNG) breakdown.Note how the commodity was stuck in a nasty downtrend, had a weak countertrend rally into resistance, then faltered once again.
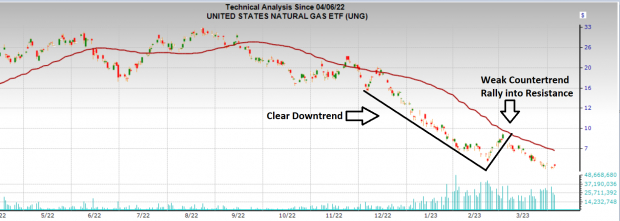
Image Source: Zacks Investment Research
Anatomy of a Bear Flag
Bear flag patterns can be identified on any time frame but are usually the clearest on the daily and weekly charts. The bear flag is a fairly straightforward pattern and is identified by two components: the flagpole (existing downtrend) and the flag (weak countertrend rally). The factors above are the most critical traits to successfully identifying the pattern because:
· Trends tend to persist: In other words, stocks that go into a pattern from a downtrend are likely to come out of it to the downside and vice versa. As the old Wall Street adage goes, “The trend is your friend.”
· Weak countertrend rallies tend to fail: A weak countertrend rally tells us that the pattern is still intact and the price will likely continue its downtrend. The lack of buying pressure in the rally proves that bears are still in control of the market, and the rally is merely a temporary pause in the overall downtrend.
The flagpole and the bear flag are the only non-negotiable factors to consider. However, below are some more traits that tend to occur in bear flags:
1. Relative Weakness: The idea of trading bear flags is to exploit weak stocks. Stick to securities underperforming the S&P 500 Index and the general market – this will increase your odds of success.
2. Moving Average Resistance: Bear flags tend to hit resistance at key moving averages such as the 50-day or the 200-day moving average. Beyond the fact that weak stocks tend to stall at moving averages, investors can afford themselves a better risk-reward zone by using the moving average. If the stock moves back above the moving average, cut your losses.
3. Weak response to positive news: A classic “tell” to consider is when a stock has does not react, or worse, has an adverse reaction to positive news.
3 Stocks Setting up Potential Bear Flags
The current market environment is a trader’s paradise and a classic stock pickers market. Strong stocks are very strong, while weak stocks are very weak. Below are 3 securities setting up potential bear flags:
Chesapeake Energy (CHK): After OPEC shocked energy markets by unexpectedly cutting crude oil production, the first week of April was a standout week for crude oil and energy stocks. However, you wouldn’t know that by looking at a chart of Chesapeake Energy. While the U.S. Oil Fund ETF (USO) and stocks like Exxon Mobil (XOM) were up nearly 6%, CHK finished the week slightly lower. Over the past few weeks, CHK has been staging a feeble rally on low volume. A break below ~$75 would trigger a potential short sale zone for the Zacks Rank #5 (Strong Sell) stock.
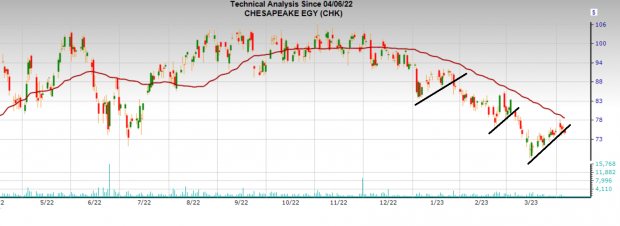
Image Source: Zacks Investment Research
Block (SQ): Two weeks ago, payment firm Block was the victim of a short-sell hit piece from Hindenburg Research. Hindenburg Research recently made headlines by casting major doubts about Indian conglomerate Adani Group – causing a dive in the stock price. After the short piece on Block claimed inflated user counts for Block’s Cash App product, shares flushed lower. Block management released a statement within days defending the company and promising to sue Hindenburg Research. Since then, the stock has had a feeble rally into resistance. If SQ breaks this week’s low of $65.81 it will trigger a potential short-sale opportunity.
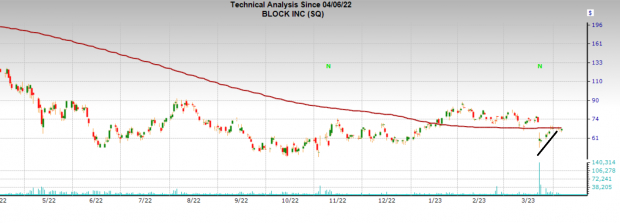
Image Source: Zacks Investment Research
Small Cap Russell 2000 Index ETF (IWM): Small caps have been the definition of relative weakness. Year-to-date, the IWM is flat, while the Nasdaq 100 Index ETF (QQQ) is up nearly 20%. IWM is comprised of about 20% financials and a bunch of regional banks. The SPDR Regional Bank ETF (KRE) is down 30% on the year as the drastic ramp in the Fed funds rate has caused unexpected issues in weaker regional banks. After getting hit and moving sideways for a few weeks, KRE once again looks vulnerable.
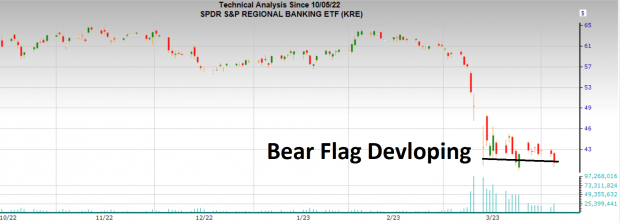
Image Source: Zacks Investment Research
If KRE breaks down, small caps are likely to follow. IWM is also showing relative weakness on a short-term basis. While the S&P 500 Index ETF (SPY) was essentially flat on the week, IWM dove more than 2%. If IWM starts trading below the $172 area early next week, it may flush to the recent lows.
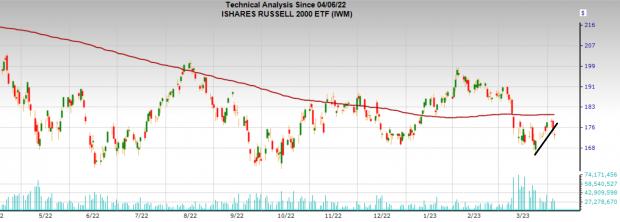
Image Source: Zacks Investment Research
Bottom Line
Shorting is always a challenging endeavor. However, with the current market environment, savvy long/short traders can find success by sizing up the technical patterns in individual securities and managing risk. Remember to keep it simple: for longs, stick to strong up-trending stocks pulling back. For short opportunities, look for stocks stuck in downtrends rallying weakly into resistance.
Zacks Names "Single Best Pick to Double"
From thousands of stocks, 5 Zacks experts each have chosen their favorite to skyrocket +100% or more in months to come. From those 5, Director of Research Sheraz Mian hand-picks one to have the most explosive upside of all.
It’s a little-known chemical company that’s up 65% over last year, yet still dirt cheap. With unrelenting demand, soaring 2022 earnings estimates, and $1.5 billion for repurchasing shares, retail investors could jump in at any time.
This company could rival or surpass other recent Zacks’ Stocks Set to Double like Boston Beer Company which shot up +143.0% in little more than 9 months and NVIDIA which boomed +175.9% in one year.
Free: See Our Top Stock and 4 Runners Up >>Exxon Mobil Corporation (XOM) : Free Stock Analysis Report
Chesapeake Energy Corporation (CHK) : Free Stock Analysis Report
Invesco QQQ (QQQ): ETF Research Reports
SPDR S&P 500 ETF (SPY): ETF Research Reports
iShares Russell 2000 ETF (IWM): ETF Research Reports
United States Oil ETF (USO): ETF Research Reports
Block, Inc. (SQ) : Free Stock Analysis Report
SPDR S&P Regional Banking ETF (KRE): ETF Research Reports
United States Natural Gas ETF (UNG): ETF Research Reports
To read this article on Zacks.com click here.
The views and opinions expressed herein are the views and opinions of the author and do not necessarily reflect those of Nasdaq, Inc.

