The Nasdaq-100® represents $10.6 trillion in market capitalization and is comprised of the 100 largest non-financial, Nasdaq listed companies. During the Covid-19 crisis, the Nasdaq-100® has had a remarkable streak of outperformance relative to all other major US-equity index peers. This outperformance can be broken down across industries, company size and other factors.
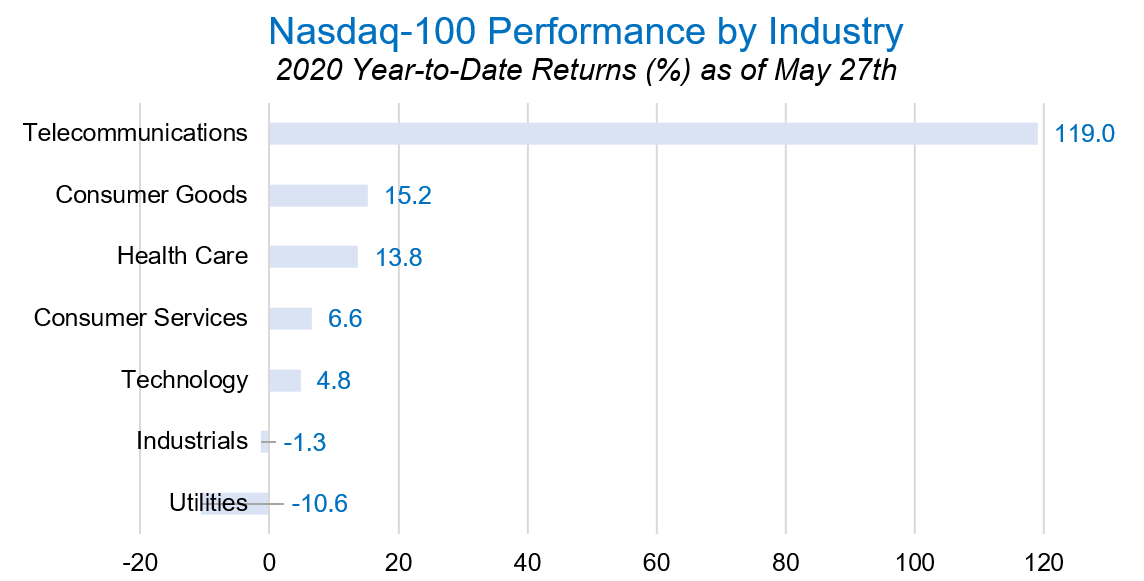
The highest performance industry within the Nasdaq-100® has been in telecommunications, largely driven by T-Mobile (TMUS) and Zoom (ZM), although this industry only makes up 1.5% of the index. Consumer Goods, Health Care, and Consumer Services also drove positive performance while Utilities and Industrials had a negative contribution to performance.
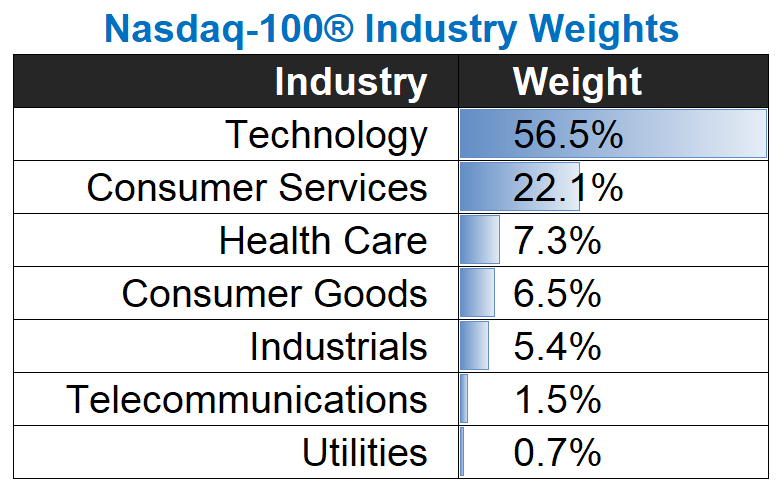
The two largest industries within the Nasdaq-100® are Technology and Consumer Services, making up a combined weight of 78.6% of the index
Size was the primary factor that drove outperformance relative to the S&P 500 Index.
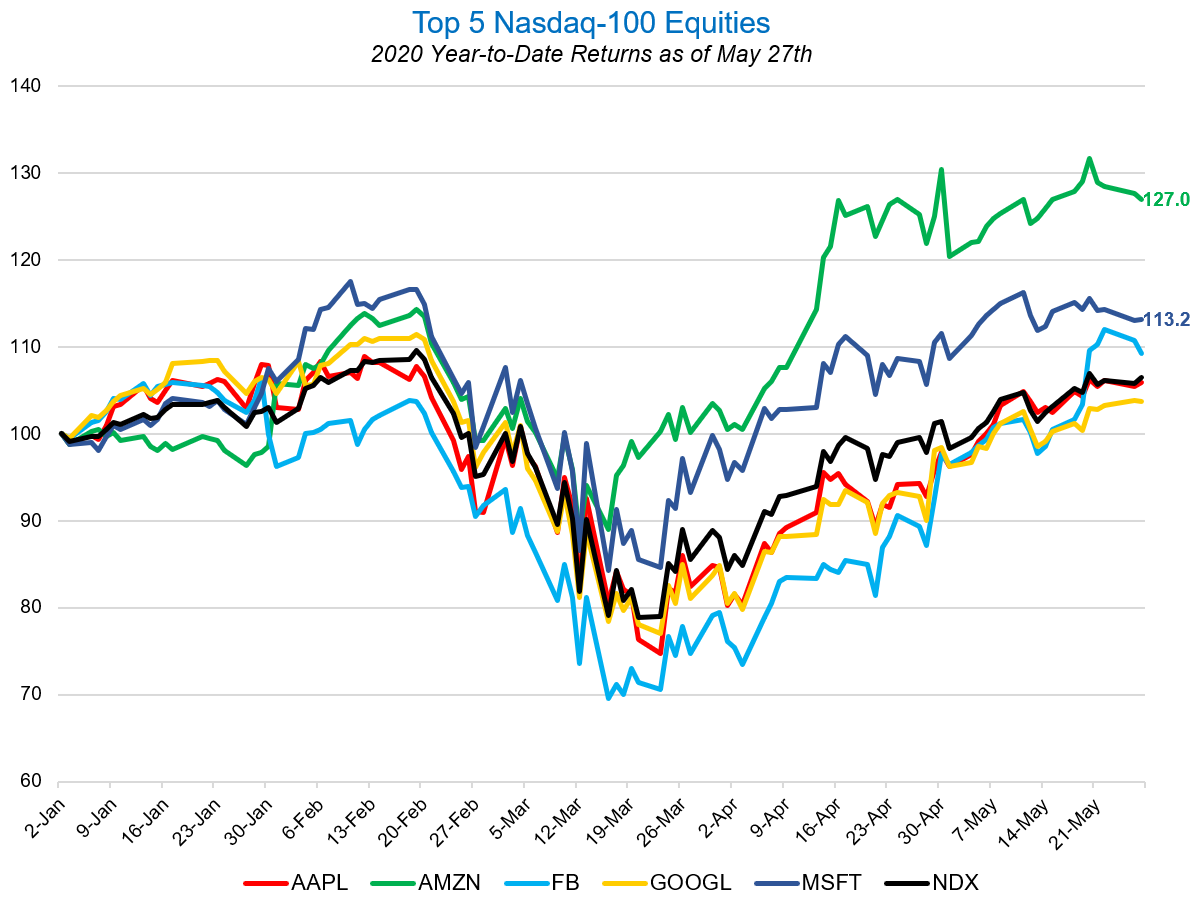
The five largest companies in the Nasdaq-100®, Apple, Microsoft, Facebook, Google, and Amazon, comprise 45.0% of the index. A great deal of the positive performance of the Nasdaq-100® can be attributed to these ultra-large-cap names, particularly Amazon and Microsoft, which together make up 21.2% of the Index and have realized double-digit returns.
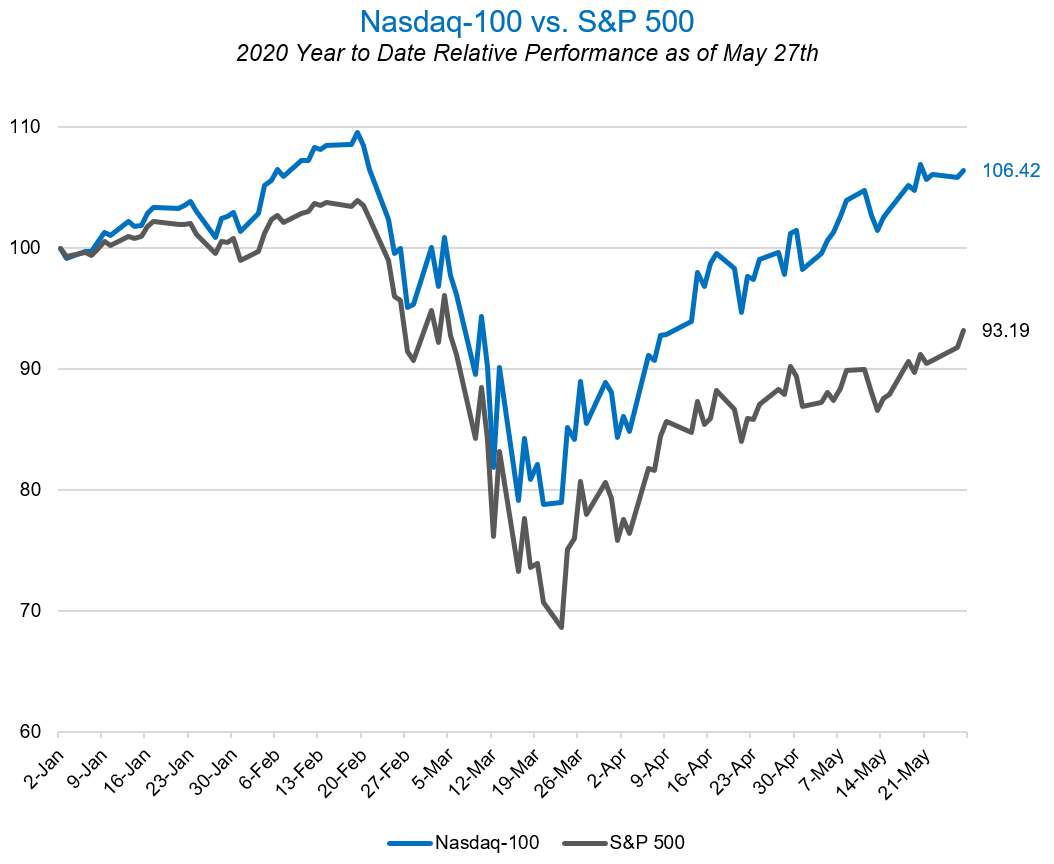
The Nasdaq-100® outperformed the S&P 500 by 14.2% on a year-to-date basis. This outperformance seems to indicate that Covid-19 has made “big-tech” even bigger. It’s no secret that Covid-19 has significantly benefited companies such as Amazon and Zoom. But the virus and resulting work-from-home and contactless environment has also accelerated a structural and fundamental shift in the economy toward automation and digitization; Nasdaq-100 companies have been among the largest beneficiaries.
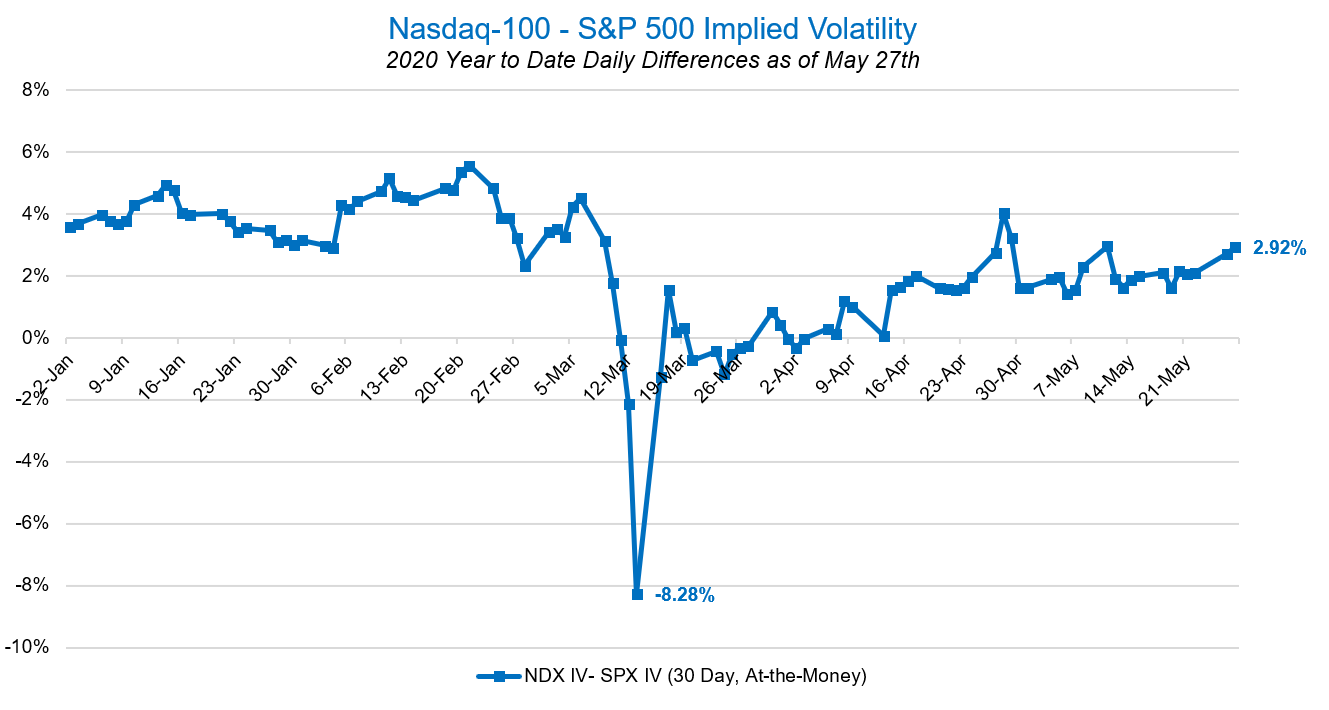
Another reason for the index’s outperformance relative to the S&P 500 is that the Nasdaq-100® is not exposed to energy, real-estate, and financial services companies, many of which are facing issues related to record-low oil prices and stressed credit markets. This stress is perhaps well represented in the options markets. The plot below shows that the difference in implied volatilities of the Nasdaq-100 (NDX) and S&P 500 (SPX) index options went negative in late March, a rare signal that the expected volatility of SPX is greater than NDX.
As the economy reopens will the Nasdaq-100® continue to outperform? Will a return to normalcy close the performance gap between these two major market indexes? Historical data seems to indicate that further outperformance is likely, given the Nasdaq-100® has outperformed the S&P 500 in 12 of the last 14 years, and by an average of 6.91% when considering 2020. Investors will surely continue to monitor the outperformance of the Nasdaq-100® as the economy navigates Covid-19 and begins to reopen.
The views and opinions expressed herein are the views and opinions of the author and do not necessarily reflect those of Nasdaq, Inc.
In This Story
NDX
Volos Portfolio Solutions
Volos provides financial Indexes and technology for institutional investors. We specialize in indexes for options and derivatives strategies, providing transparency to this traditionally opaque asset class. We offer software to investors to design tailored options strategies through our backtesting web application and provide in-depth analysis around different options strategies through our strategy platforms. In 2021, we launched NDX Connect in partnership with Nasdaq. NDX Connect is a strategy platform that provides institutional investors with an unfettered capability to utilize NDX index options.
Read Volos' Bio