
In today's fast-paced and highly competitive business world, it is crucial for investors and industry followers to conduct comprehensive company evaluations. In this article, we will delve into an extensive industry comparison, evaluating Amazon.com (NASDAQ:AMZN) in relation to its major competitors in the Broadline Retail industry. By closely examining key financial metrics, market standing, and growth prospects, our objective is to provide valuable insights and highlight company's performance in the industry.
Amazon.com Background
Amazon is the leading online retailer and marketplace for third party sellers. Retail related revenue represents approximately 75% of total, followed by Amazon Web Services' cloud computing, storage, database, and other offerings (15%), advertising services (5% to 10%), and other the remainder. International segments constitute 25% to 30% of Amazon's non-AWS sales, led by Germany, the United Kingdom, and Japan.
| Company | P/E | P/B | P/S | ROE | EBITDA (in billions) | Gross Profit (in billions) | Revenue Growth |
|---|---|---|---|---|---|---|---|
| Amazon.com Inc | 33.75 | 7.19 | 3.43 | 5.79% | $36.48 | $78.69 | 8.62% |
| Alibaba Group Holding Ltd | 16.06 | 2.03 | 2.09 | 1.23% | $59.0 | $117.63 | -15.6% |
| PDD Holdings Inc | 10.72 | 3.09 | 2.64 | 4.59% | $16.09 | $54.73 | 10.21% |
| MercadoLibre Inc | 63.32 | 26.08 | 5.83 | 10.56% | $0.92 | $2.77 | 36.97% |
| Coupang Inc | 202.50 | 11.77 | 1.67 | 2.53% | $0.36 | $2.32 | 11.16% |
| JD.com Inc | 8.14 | 1.48 | 0.31 | 4.6% | $14.27 | $47.85 | 15.78% |
| eBay Inc | 18.53 | 7.18 | 3.66 | 9.95% | $0.77 | $1.86 | 1.13% |
| Vipshop Holdings Ltd | 7.45 | 1.33 | 0.51 | 4.85% | $2.45 | $6.08 | -4.98% |
| Ollie's Bargain Outlet Holdings Inc | 35.20 | 4.06 | 3.02 | 2.78% | $0.07 | $0.24 | 13.35% |
| Dillard's Inc | 11.06 | 3.36 | 0.97 | 8.97% | $0.31 | $0.74 | -24.6% |
| MINISO Group Holding Ltd | 16.61 | 3.77 | 2.30 | 3.98% | $0.65 | $1.96 | 18.89% |
| Macy's Inc | 5.78 | 0.72 | 0.14 | 0.84% | $0.68 | $3.02 | -40.14% |
| Savers Value Village Inc | 76.07 | 3.99 | 1.14 | -1.13% | $0.03 | $0.2 | 4.51% |
| Kohl's Corp | 7.46 | 0.24 | 0.06 | -0.4% | $0.31 | $1.92 | -40.1% |
| Hour Loop Inc | 125.40 | 7.58 | 0.32 | 11.93% | $0.0 | $0.01 | 4.68% |
| Average | 43.16 | 5.48 | 1.76 | 4.66% | $6.85 | $17.24 | -0.62% |
By closely examining Amazon.com, we can identify the following trends:
-
At 33.75, the stock's Price to Earnings ratio is 0.78x less than the industry average, suggesting favorable growth potential.
-
It could be trading at a premium in relation to its book value, as indicated by its Price to Book ratio of 7.19 which exceeds the industry average by 1.31x.
-
The stock's relatively high Price to Sales ratio of 3.43, surpassing the industry average by 1.95x, may indicate an aspect of overvaluation in terms of sales performance.
-
The Return on Equity (ROE) of 5.79% is 1.13% above the industry average, highlighting efficient use of equity to generate profits.
-
The company exhibits higher Earnings Before Interest, Taxes, Depreciation, and Amortization (EBITDA) of $36.48 Billion, which is 5.33x above the industry average, implying stronger profitability and robust cash flow generation.
-
The gross profit of $78.69 Billion is 4.56x above that of its industry, highlighting stronger profitability and higher earnings from its core operations.
-
The company's revenue growth of 8.62% exceeds the industry average of -0.62%, indicating strong sales performance and market outperformance.
Debt To Equity Ratio
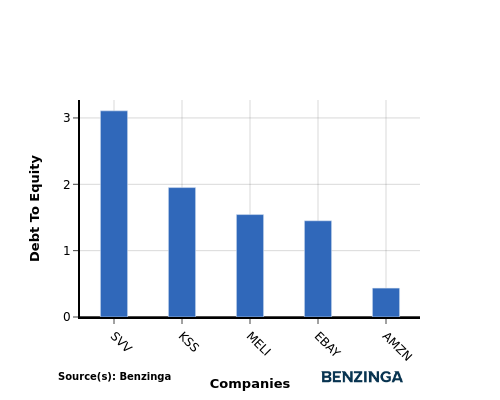
The debt-to-equity (D/E) ratio gauges the extent to which a company has financed its operations through debt relative to equity.
Considering the debt-to-equity ratio in industry comparisons allows for a concise evaluation of a company's financial health and risk profile, aiding in informed decision-making.
When examining Amazon.com in comparison to its top 4 peers with respect to the Debt-to-Equity ratio, the following information becomes apparent:
-
When comparing the debt-to-equity ratio, Amazon.com is in a stronger financial position compared to its top 4 peers.
-
The company has a lower level of debt relative to its equity, indicating a more favorable balance between the two with a lower debt-to-equity ratio of 0.44.
Key Takeaways
For Amazon.com, the PE ratio is low compared to its peers in the Broadline Retail industry, indicating potential undervaluation. The high PB and PS ratios suggest that the market values Amazon.com's assets and sales highly. Amazon.com's high ROE, EBITDA, gross profit, and revenue growth outperform its industry peers, reflecting strong financial performance and growth potential.
This article was generated by Benzinga's automated content engine and reviewed by an editor.
Latest Ratings for AMZN
| Date | Firm | Action | From | To |
|---|---|---|---|---|
| Jun 2025 | JP Morgan | Maintains | Overweight | Overweight |
| Jun 2025 | B of A Securities | Maintains | Buy | Buy |
| May 2025 | Tigress Financial | Maintains | Buy | Buy |
View More Analyst Ratings for AMZN
View the Latest Analyst Ratings
© 2025 Benzinga.com. Benzinga does not provide investment advice. All rights reserved.
The views and opinions expressed herein are the views and opinions of the author and do not necessarily reflect those of Nasdaq, Inc.

