

Key takeaways
Performance recap
Higher-quality bonds have outperformed so far this year as Treasury yields broadly declined and credit spreads widened. Tariff policy vacillation and weaker consumer sentiment data sparked fears of an economic growth slowdown. Positive bond returns helped cushion the volatility in U.S. stocks.
The big picture
The implementation of higher-than-expected tariffs in the U.S. will have substantial economic impact if maintained. Consequently, we revised our growth and labor market forecasts down and increased our outlook for inflation. While the likelihood of a recession has risen, the underlying economic fundamentals still show signs of strength. Inflation pressures could limit the Federal Reserve’s policy options.
Our approach
Before the tariff announcements, we trimmed credit risk and moved up in quality. We remain optimistic on interest rates, favoring intermediate maturities as a hedge against our credit exposure. Credit valuations have improved, but not sufficiently to offset the increased uncertainty. We are overweight sectors that are more resilient to growth and policy risks. In municipal bonds, we anticipate strong flows into the summer months and see significant value in high-quality bonds at the long end of the curve.
Sara Devereux, Global Head of Fixed Income Group
Chris Alwine, CFA Global Head of Credit
Roger Hallam, CFA Global Head of Rates
Paul Malloy, CFA Head of U.S. Municipals
Dan Larkin, CFA Senior Investment Specialist Active Fixed Income
Nathaniel Earle, CFA Senior Investment Specialist Active Fixed Income
A tidal shift
There is a tidal shift ongoing in the global economy. The Trump administration surprised the market with a broad new round of tariffs on April 2 before declaring a pause for many partners a week later. Uncertainty remains about where negotiations will go, which tariffs will ultimately be implemented, and how long they will last. These and other questions, such as the burgeoning federal debt levels, are complex, structural issues that will not be resolved quickly.
The far-reaching economic implications have led us to reassess our 2025 outlook. We believe this stagflationary impact will dampen growth and help hold inflation higher in coming months. The rising risk of a recession keeps us optimistic on interest rates and defensive on credit for now. We are navigating increasingly uncertain waters, where the global economic tidal transition has taken on a more unsettled tone.
In recent weeks, U.S. fixed income has seen credit spreads widen to their highest levels since the onset of the COVID-19 pandemic in March 2020, and before that, the 2008 global financial crisis. Treasury rates were volatile, sharply declining at the end of the quarter due to recession fears, which triggered a flight to quality. They then retraced, especially on the long end of the yield curve, where technical factors exacerbated price movements.
From risks to realities
We expect higher market volatility to continue. The economic and policy focus has shifted from assessing potential risks to managing realities. Soft sentiment indicators will soon give way to hard results on inflation, trade balances, employment, wages, and earnings. In the meantime, businesses will reassess their costs and plans, even as governments weigh their options.
Monetary policy is also at the center of attention. We anticipate that the Fed will be reluctant to reduce rates until it has greater clarity around the near- and medium-term impacts from higher tariffs. If the labor market weakens materially and recession concerns rise, we think the Fed can and will support the economy as necessary, provided long-term inflation expectations are stable.
Investors will need the durability that comes through diversification. We believe bonds remain well positioned to offer attractive income and higher returns if downside risks increase. We have put our global capabilities to use in identifying opportunities, and we think investors will find that fixed income diversification will help their portfolios retain buoyancy in these swirling seas.
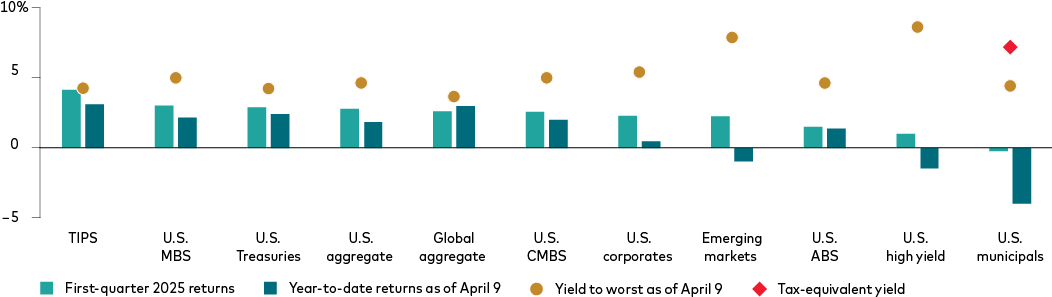
Note: The municipal tax-equivalent yield is calculated using a 40.8% tax bracket, which includes a 37.0% top federal marginal income tax rate and the 3.8% net investment income tax to fund Medicare. Yield to worst represents the lowest yield possible for a security given the current price, taking into account both call dates and maturity.
Sources: Bloomberg indexes and JPMorgan, as of April 9, 2025. See page 3 for a full list of indexes.
Past performance is no guarantee of future returns. The performance of an index is not an exact representation of any particular investment, as you cannot invest directly in an index.
U.S. economy and policy
While recent U.S. economic activity remains firm, questions remain regarding when and to what degree recent negative signs in soft data points—the so-called “vibecession”—will flow through to hard data such as retail sales, employment, and growth over the coming months.
In recent years, the correlation between soft and hard data has been weak. However, given the magnitude of the recent tariff announcements, not to mention fiscal cost cutting, we anticipate broader economic weakness in the months ahead. Persistent uncertainty will act as a tax on the economy, further restraining corporate and household spending.
An evolving outlook
Our central case scenario for the U.S. entering 2025 called for continued strong growth, with inflation stuck in the mid-2% range. We acknowledged more possibilities due to expected policy changes and highlighted several prospects beyond our base case.
We’ve updated our outlook due to the broader-ranging tariff policy and added friction from higher levels of business and household uncertainty. A stagflationary-impact scenario is now our base case forecast.
Weaker growth, higher inflation
Our revised outlook for the U.S. accounts for the effective tariff rate to settle above 15%, which represents a substantial increase in the aggregate rate compared to 2024. Even with the pause in reciprocal tariffs, we maintain the following forecasts:
- Gross domestic product (GDP): U.S. 2025 GDP growth below 1%.
- Inflation: Year-end 2025 core inflation (as measured by the Personal Consumption Expenditures price index) increasing by more than a percentage point to nearly 4% year over year.
- Labor: The unemployment rate rising by more than half a percentage point to around 5%.
Economic Policy Uncertainty Index spikes to record levels after U.S. tariffs announced

Note: The daily news-based Economic Policy Uncertainty Index is based on newspaper coverage of policy-related economic uncertainty from Access World News NewsBank Inc.
Source: Economic Policy Uncertainty Index, Policyuncertainty.com, as of April 9, 2025.
Indexes used in charts: The following indexes are represented in the sector returns and yields chart on page 2: Bloomberg U.S. Corporate High Yield Index, J.P. Morgan EMBI Global Diversified Index, Bloomberg U.S. Asset-Backed Securities Index, Bloomberg CMBS: Erisa Eligible Index, Bloomberg U.S. Corporate Index, Bloomberg U.S. Treasury Inflation-Linked Bond Index (Series-L), Bloomberg U.S. Aggregate Index, Bloomberg U.S. Mortgage Backed Securities Index, Bloomberg U.S. Municipal Index, Bloomberg U.S. Treasury Index, and Bloomberg Global Aggregate Index.
Higher inflation will challenge the Fed. We anticipate the Fed will be on hold in the near term, but that its year-end 2025 target for the federal funds rate will fall to a range of 3.25%–4% as it seeks to support a slowing economy.
- On inflation: The Fed will assess any tariff-related price increases and determine what can be looked through as a transitory price increase and what may have medium-term effects. This will guide how much the Federal Open Market Committee needs to lean into the inflation side of its mandate and how long policy rates remain restrictive. For the Fed to ease policy, it needs to be confident that medium-term inflation expectations remain anchored at levels consistent with a 2% rate.
- On employment: The labor market is currently balanced, with 1.1 job openings for every job seeker. The hiring slowdown so far primarily reflects a reduction in job openings, which has had a muted effect on the unemployment rate. Additional softening in labor demand will have a bigger impact.
While the probability of a 2025 recession has increased, it is not our base case. However, if that were to occur, we expect that the Fed would meaningfully cut interest rates to support the economy.
U.S. rates and yield curve
Yields on 10-year Treasuries moved as high as 4.80% early in the year as markets reflected optimism about expected pro-growth policies. By mid-January, market expectations for the Fed showed only 1.5 cuts priced in for 2025. However, rising growth concerns resulting from tariffs and fiscal cost-cutting pulled yields lower. By mid-April, the market’s expectations for Fed rate reductions had increased to between three and four cuts.
Treasury yields in April have been volatile amid heightened policy uncertainty. The net result has been a steeper yield curve, as the difference between 10-year and 2-year yields increased above 50 basis points (bps). Rising growth risks have pulled front-end yields down while longer-end yields increased, driven by short-term technical pressures and term-premium concerns.
Inflation expectations have risen for the short-term but remain low long-term

Source: Bloomberg, as of April 14, 2025.
Notes: The breakeven inflation rate represents a measure of expected inflation derived from 2- and 10-Year Treasury Constant Maturity Securities and 2- and 10-Year Treasury Inflation-Indexed Constant Maturity Securities. The latest value implies what market participants expect inflation to be in the next 2 and 10 years, on average.
U.S. Treasury yield curve moves higher after tariff announcements

Source: Bloomberg, as of April 9, 2025.
Past performance is no guarantee of future returns.
Our revised outlook reinforces our confidence that U.S. rates will trend lower. We favor intermediate durations, as the short end is susceptible to monetary policy uncertainty, and the long end faces risks from technical factors, inflation, and fiscal spending concerns.
We are monitoring conditions that could push rates higher. For example, continued volatility and uncertainty may lead to a higher term premium, and growing worries about U.S. fiscal deficits could also play a role. However, we believe slowing growth and easier monetary policy will prove to be the dominant drivers of Treasury yields in the months ahead.
The bottom line: We expect Treasuries to remain effective hedges for risk assets if economic momentum shows credible signs of slowing. Short- and intermediate-maturity Treasury yields can fall substantially if the odds of a recession rise, providing diversification for credit.
Credit outlook
Credit spreads moved gradually wider over the final weeks of the first quarter before spiking in the days following the April 2 tariff announcements, as markets priced in a justifiably higher risk premium across sectors.
We reduced our credit exposure in early March ahead of the larger move in spreads. We remain cautious but opportunistic. Although valuations are now more attractive compared to the start of the year, they haven’t reached levels that justify broad-based buying. It’s unlikely that spreads will return anytime soon to the narrow levels seen earlier this year. If recession risks increase, we expect spreads to widen significantly.
We remain defensively positioned in segments of credit that have greater earnings stability and less exposure to tariff risks. For now, we are more selective in lower-quality sectors and are focusing on individual issuers, given higher vulnerability to weaker growth.
Despite shifts in sentiment, strong corporate and consumer-backed credit fundamentals persist, along with robust investor demand.
Perspective on corporate fundamentals
Since the COVID-19 pandemic, we have consistently emphasized the strong position of U.S. corporate balance sheets. The effects of tariff policies will be felt unevenly across sectors and will vary for each company. Our direct engagement with management teams and our extensive analyst coverage enable us to assess each company’s situation individually, allowing us to determine fair-value price levels for its respective debt.
In the months ahead, we expect companies to pull or lower earnings guidance, which had been at very optimistic levels for 2025. We’ll see which companies are able to pass on higher costs to consumers and the degree to which demand is impacted by price changes. We think the best opportunities today are in pharmaceuticals and utilities, as well as banks, which are well capitalized and can continue to benefit from deregulation.
Views on the U.S. consumer
We continue to see positive signs in the following categories:
- Disposable income: Levels have grown in recent years, in line with longer-term trends.
- Household wealth: This has also grown, while the gap in consumer spending above income level has been closing.
- Borrowing capacity: Households are not overleveraged when measured relative to consumption, and they have more capacity to borrow if needed.
- Loan delinquencies: These are rising, but remain near historically normal levels.
But we also have some concerns:
- Consumer surveys: Recent results have shown notable weakness. Given the magnitude of policy changes, the link between sentiment and actual spending patterns could be meaningful, especially if broader job losses occur.
- Stress: We have seen more pronounced stress for lower-credit-score borrowers. While that cohort represents a smaller portion of overall borrowing, it may highlight the starting point in a broader slowdown.
- Shifting gears: Increasing inflationary pressures, slowing savings rate, and/or wealth declines could all represent derailleurs to a strong consumer.
Credit spreads widened suddenly in late March and early April 2025
(in bps, from April 9, 2024, through April 9, 2025)

Source: Bloomberg, as of April 9, 2025.
Past performance is no guarantee of future returns. The performance of an index is not an exact representation of any particular investment, as you cannot invest directly in an index.
Indexes used in charts: On the chart credit spreads charts above, the following indexes are represented: Bloomberg U.S. Corporate High Yield Index; Bloomberg Global High Yield Index; Bloomberg US Corporate Index; Bloomberg Pan European Corporate Index; J.P. Morgan EMBIG Diversified Index; Bloomberg U.S. ABS Index; Bloomberg U.S. CMBS Index; J.P. Morgan CEMBI Broad Diversified Index.
A sea change in international markets
Global bonds present more opportunity and are undergoing a significant shift as the U.S. economic exceptionalism narrative fades, not only due to the potential for a U.S. recession, but because the rest of the world is stepping up. This transformation is evident through changes in spending and monetary policies, particularly in Europe.
Europe is attempting a fiscal renaissance
For years, Europe has lagged the world in economic growth, primarily due to insufficient spending on the private sectors of the economy. However, we believe the continent has reached a turning point.
- Germany’s initiative: In March, Germany, the E.U.’s economic powerhouse, approved a €500 billion infrastructure program after incoming chancellor Friedrich Merz declared that the country must do “whatever it takes” to bolster defense. This program, along with the relaxation of the “debt brake” rule on defense spending, is expected to transform economic activity across Europe. These changes have led to a sell-off in German bunds. We took advantage by being short on bunds with the expectation that yields would rise.
- Economic impact: The German initiative is expected to boost internal production and revitalize the industrial complex, which has declined due to increased competition from China in the electric vehicle market and faltering demand for European automobiles. New spending could add nearly 1 percentage point to German GDP, reversing a two-year contraction.
- Role of the European Central Bank (ECB): The ECB has supported this shift by cutting interest rates, maintaining a steady pace of 25-basis-point cuts. This has reduced financing costs, making credit more accessible and fostering a more cohesive and solidary European economy with stronger growth prospects.
Germany’s fiscal plan could significantly affect euro area growth, inflation, and monetary policy
Percentage-point economic impact on the euro area under three scenarios
German fiscal expansion (% of GDP)

Notes: The chart shows the modeled impact on euro area macroeconomic fundamentals under three German fiscal expansion scenarios, including the fiscal deficit widening by 1 percentage point of GDP, 2 percentage points of GDP, and 3 percentage points of GDP. GDP refers to the estimated cumulative impact on the level of euro area GDP by year-end 2025 and 2026. Headline Consumer Price Index (CPI) refers to the average annual headline CPI rates. Policy rate refers to the ECB deposit facility rate by year-end.
Sources: Vanguard calculations, based on data from Bloomberg and Oxford Economics, as of March 10, 2025.
Squeeze play: German/U.S. compression created active opportunity

Source: FactSet, as of March 31, 2025.
An entry point in German bunds
- As German bunds sell off, we would view an approximate 3% yield on a 10-year bund as a compelling buying opportunity. The abundance of willing buyers suggests a stable and attractive investment environment. For cross-currency investors, European yields are now appealing to Asian and American investors, offering a positive pickup even after hedging.
Positive outlook for periphery countries
In fixed income markets, we have been overweight in periphery countries like Spain and Greece for over a year, and this strategy has paid off. These economies have outperformed expectations, demonstrating resilience and growth potential.
- Debt profiles: With Germany and France leading new spending, the positive economic momentum is expected to improve the debt profiles of weaker countries. We expect a continued contraction in sovereign spreads, indicating improved creditworthiness and reduced risk.
- Market support: The European Union’s requirement for solidarity among member states further bolsters weaker credits, with increased market support and continued spread contraction.
- Performance: Sovereign bonds in periphery countries have seen spreads decline by 100 bps, generating 10 to 15 bps of outperformance in our portfolios that invest globally.
U.K. yield opportunities
The U.K.’s risk premium has shifted, bringing yields more in line with the U.S. rather than Germany. This is because of the ongoing effects of Brexit and high inflation. The U.K. bond market now resembles non-European countries like Australia, where short-term rates align with the country’s central bank, but long-term rates track those of the U.S. In the 30-year part of the curve, where U.K. yields offer a 30-to-50-basis-point premium, this presents a value opportunity.
Bonds from some European countries offer higher yields
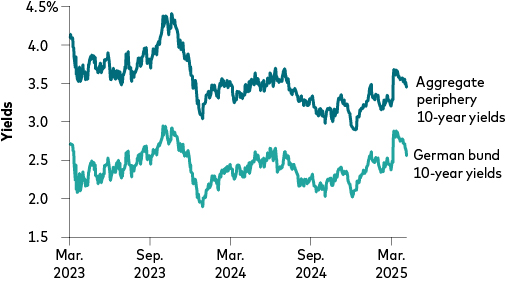
Notes: Aggregate periphery means GDP-weighted yields of Portugal, Ireland, Italy, Greece, and Spain.
Source: Macrobond, as of April 4, 2025.
Spread between aggregate periphery and Germany

Notes: Aggregate periphery means GDP-weighted yields of Portugal, Ireland, Italy, Greece, and Spain.
Source: Macrobond, as of April 4, 2025.
Japan’s economic transformation
Japan is undergoing significant changes. The market has underappreciated Japan’s shift toward more orthodox economic principles, leading to higher wage growth and rising inflation. Increasing services costs and inflation will mean that the Bank of Japan (BOJ) will need to continue raising rates, creating a dynamic and potentially lucrative investment environment.
- Investment strategy: We believe robust rates of Japanese inflation, driven by strong wage gains, with allow the BOJ to continue to normalize monetary policy faster than is discounted. We are therefore underweight shorter maturity Japanese government bonds (JGBs) and believe the JGB yield curve will flatten from its current steep levels.
Land of the rising yields

Source: Macrobond, as of April 9, 2025.
Emerging markets sovereigns: Yield with limited downside risk
Emerging markets (EM) sovereign bonds offer attractive yield and longer duration, providing lower downside risk relative to EM corporate bonds or U.S high yield. We think the asset class is underowned by investors and offers a wide range of relative value opportunities, particularly when market volatility is high.
EM corporates have outperformed their sovereign counterparts since 2022, supported by a combination of larger spread compression and a shorter duration profile. But we are now in the unusual situation where EM sovereigns are yielding more than EM corporates, which currently face additional pressure from tariffs.
In addition, EM sovereigns come with better liquidity, lower likelihood of credit surprises, and better prospects in the event of default.
Emerging markets sovereign bonds offer duration and high yields
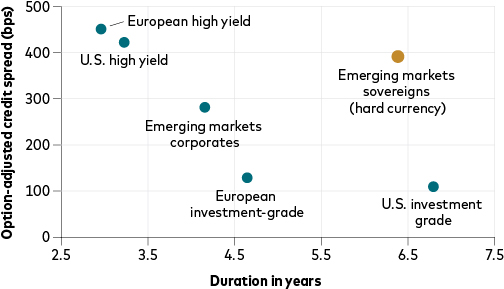
Note: Option-adjusted spread (OAS) is the yield spread to be added to a benchmark yield curve to discount a security’s payments to match its market price using a dynamic pricing model that accounts for embedded options.
Sources: Bloomberg and JPMorgan, as of April 9, 2025. U.S. high yield is represented by the ICE BofAML US High Yield Index, European high yield is represented by the ICE BofA Euro High Yield Index, European investment grade is represented by the Bloomberg Euro Aggregate Corporate Index in EUR, U.S. investment grade is represented by the Bloomberg Global Aggregate Corporate USD Index, emerging markets sovereign (hard currency) is represented by the J.P. Morgan EMBI Global Diversified Index, and emerging markets corporate is represented by the J.P. Morgan CEMBI Broad Diversified Index.
Past performance is no guarantee of future returns. The performance of an index is not an exact representation of any particular investment, as you cannot invest directly in an index.

Municipals
High-grade municipal bonds are offering investors some of the best valuations we’ve observed in years. On April 11, 2025, the Bloomberg Municipal Bond Index yield stood at 4.29%, or 7.25% on a tax-equivalent basis for taxpayers in the highest tax bracket. This places it among the top 1% of municipal bond yields observed over the last decade, providing high return potential. Furthermore, credit spreads, at around their 40th percentile, still appear cheap relative to the taxable space, offering additional value.
Moderate outflows from municipal ETFs amid broader market volatility has pushed valuations for tax-exempt debt to very attractive levels. Municipals are largely insulated from direct impacts of tariffs, so we are upbeat on their resilience in the current environment. Therefore, a calming of volatility may be followed by strong municipal bond performance—particularly during seasonally supportive summer months.
Summers are also typically light on supply and heavy on coupon and principal reinvestments. We believe this combination of valuation, fundamental, and technical tailwinds could generate meaningful flows back into mutual funds and ETFs. However, the environment is not without its idiosyncrasies. Other federal policy changes are likely to create winners and losers across the municipal credit markets, where professional active managers with a strong team of credit analysts can make all the difference.
Rare valuations
Municipal investors have an opportunity to invest in high-quality bonds offering substantial value—especially if they are willing to reach further out on the curve. Ratios for 30-year AAA muni/Treasury yields have been recently sitting in the mid-90% range. While we’ve seen higher levels in the recent past, these ratios typically compress as Treasury yields move higher and the value of the tax exemption grows on a dollar basis.
The muni-to-U.S. Treasury ratio tends to converge at higher Treasury yield levels
(Ratio of 30-year AAA municipal yields versus U.S. Treasury yields, from 2018 to 2025)

Source: Bloomberg, as of April 11, 2025.
Past performance is no guarantee of future returns.
Given these ratios, munis now make sense for investors of nearly all income levels. Take notice of the excess tax-equivalent yields that munis are offering versus Treasuries in the long end of the curve, and the extent to which this differential has grown since just the end of last year. Not only do these opportunities tend to be rare, but also short lived.
High excess tax-equivalent long-end yields over U.S. Treasuries are rare and typically short lived

Notes: The municipal tax-equivalent yield is calculated using a 40.8% tax bracket, which includes a 37.0% top federal marginal income tax rate and the 3.8% net investment income tax to fund Medicare. Tax-equivalent yield over Treasuries would be the result of subtracting Treasury yields from tax-equivalent yields.
Source: Bloomberg daily yields from March 31, 2015, to April 11, 2025.
Past performance is no guarantee of future returns.
Tax-equivalent AAA municipal yields in excess of U.S. Treasury yields

Note: The municipal tax-equivalent yield is calculated using a 40.8% tax bracket, which includes a 37.0% top federal marginal income tax rate and the 3.8% net investment income tax to fund Medicare.
Source: Bloomberg and Bloomberg BVAL AAA municipal yields, as of December 31, 2024, and April 11, 2025.
Past performance is no guarantee of future returns. The performance of an index is not an exact representation of any particular investment, as you cannot invest directly in an index.
With strong underlying municipal fundamentals in mind, we believe that market technical factors have been the driver behind “cheap” valuations for such highly rated securities. Tax-exempt muni issuance is already at a 23% increase above last year’s record pace through the end of March, perhaps because of issuers pulling new issues forward to avoid second-half policy uncertainty. On the demand side, it appears that moderate outflows from funds and ETFs during an environment of heightened broader volatility has significantly pushed up yields for highly rated bonds, despite their strong underlying fundamentals.
We believe such valuations set the stage for a summer of strong municipal bond performance. This assumes calming market volatility alongside the typical lull of issuance and ample reinvestment during those months, declining uncertainty as we get closer to the extension of the Tax Cuts and Jobs Act of 2017, crystalizing public policy, or a mix of the above. Leading up to that inflection point, we are looking to capture these attractive valuations by deploying dry powder out on the curve in highly rated bonds, as appropriate by strategy. As always, our analysts inform our selective decision-making here.
Another tailwind to consider going forward is that while 30-year AAA muni/Treasury ratios are hovering around 95%, individual bond yields are highly dispersed. Crossover buyers are getting involved, supporting the market through buying ratios near or above 100%.
“This is what we are here for.”
—Paul Malloy,
Head of municipals at Vanguard
Municipal investors are facing uncertainty around municipal-specific issues such as federal spending, tax rate changes, the scope of municipal tax exemption, and other elements. We would, however, emphasize the long history of uncertainty with each iteration of tax reform. Furthermore, as Vanguard Head of Municipals Paul Malloy indicated in a recent article in The Wall Street Journal, policy uncertainty is just one of many other uncertainties we’ve managed over the years, alongside others like the COVID-19 pandemic. In his words, “This is what we are here for; we are designed for this. This is what our investors expect of us.”
At Vanguard, we will navigate these conditions utilizing a deep team of industry-expert analysts, smart risk-taking, and multiple levers of diversified alpha. Our positions will evolve along with the markets, as our analyst team evaluates the municipal landscape issue-by-issue, bond-by-bond, to guide our portfolios.
The big takeaway: Investors should be enthusiastic about what municipal valuations entail for future returns and entrust their assets to well-resourced, experienced managers with a strong track record in such environments.


* As reported in each fund’s prospectus. A fund’s current expense ratio may be higher or lower than the figure shown.
† Investment advisor: Wellington Management Company LLP.
‡ Investor Shares available only. There is no minimum investment required for advised clients.
Note: Data as of March 31, 2025.
Active fixed income leadership team
Sara Devereux
Global Head of Fixed Income Group
In industry since 1992
Chris Alwine, CFA
Global Head of Credit
In industry since 1990
Roger Hallam, CFA
Global Head of Rates
In industry since 2000
Paul Malloy, CFA
Head of U.S. Municipals
In industry since 2005
Active fixed income at Vanguard
$472B
Vanguard Global Active Bond AUM
$277B Vanguard Global Active Taxable Bond AUM
$195B Vanguard Global Active Municipal Bond AUM
25+ Portfolio managers
35+ Traders
60+ Credit research analysts
130+ Dedicated team members
Note: Data as of March 31, 2025.
For more information about active fixed income, speak with your financial advisor.
Connect with Vanguard® • advisors.vanguard.com • 800-997-2798
For more information about Vanguard funds or Vanguard ETFs, visit advisors.vanguard.com or call 800-997-2798 to obtain a prospectus or, if available, a summary prospectus. Investment objectives, risks, charges, expenses, and other important information about a fund are contained in the prospectus; read and consider it carefully before investing.
Vanguard ETF Shares are not redeemable with the issuing Fund other than in very large aggregations worth millions of dollars. Instead, investors must buy and sell Vanguard ETF Shares in the secondary market and hold those shares in a brokerage account. In doing so, the investor may incur brokerage commissions and may pay more than net asset value when buying and receive less than net asset value when selling.
Past performance is no guarantee of future results. All investing is subject to risk, including possible loss of principal. Diversification does not ensure a profit or protect against a loss.
Bonds of companies based in emerging markets are subject to national and regional political and economic risks and to the risk of currency fluctuations. These risks are especially high in emerging markets.
High-yield bonds generally have medium- and lower-range credit-quality ratings and are therefore subject to a higher level of credit risk than bonds with higher credit-quality ratings.
U.S. government backing of Treasury or agency securities applies only to the underlying securities and does not prevent share price fluctuations. Unlike stocks and bonds, U.S. Treasury bills are guaranteed as to the timely payment of principal and interest.
Bond funds are subject to interest rate risk, which is the chance bond prices overall will decline because of rising interest rates, and credit risk, which is the chance a bond issuer will fail to pay interest and principal in a timely manner or that negative perceptions of the issuer’s ability to make such payments will cause the price of that bond to decline.
Investments in bonds issued by non-U.S. companies are subject to risks including country/regional risk and currency risk.
Although the income from a municipal bond fund is exempt from federal tax, you may owe taxes on any capital gains realized through the fund’s trading or through your own redemption of shares. For some investors, a portion of the fund’s income may be subject to state and local taxes, as well as to the federal Alternative Minimum Tax.
Be aware that fluctuations in the financial markets and other factors may cause declines in the value of your account. There is no guarantee that any particular asset allocation or mix of funds will meet your investment objectives or provide you with a given level of income.
CFA® is a registered trademark owned by CFA Institute.
Investment Products: Not a Deposit • Not FDIC Insured • Not Guaranteed by the Bank • May Lose Value • Not Insured by Any Federal Government Agency
© 2025 The Vanguard Group, Inc.
All rights reserved. Vanguard Marketing Corporation, Distributor.
Latest articles

This data feed is not available at this time.
Data is currently not available