
These 4 Measures Indicate That Joint (NASDAQ:JYNT) Is Using Debt Reasonably Well
Warren Buffett famously said, 'Volatility is far from synonymous with risk.' So it might be obvious that you need to consider debt, when you think about how risky any given stock is, because too much debt can sink a company. We can see that The Joint Corp. (NASDAQ:JYNT) does use debt in its business. But the real question is whether this debt is making the company risky.
Why Does Debt Bring Risk?
Generally speaking, debt only becomes a real problem when a company can't easily pay it off, either by raising capital or with its own cash flow. In the worst case scenario, a company can go bankrupt if it cannot pay its creditors. However, a more common (but still painful) scenario is that it has to raise new equity capital at a low price, thus permanently diluting shareholders. Of course, plenty of companies use debt to fund growth, without any negative consequences. When we think about a company's use of debt, we first look at cash and debt together.
What Is Joint's Debt?
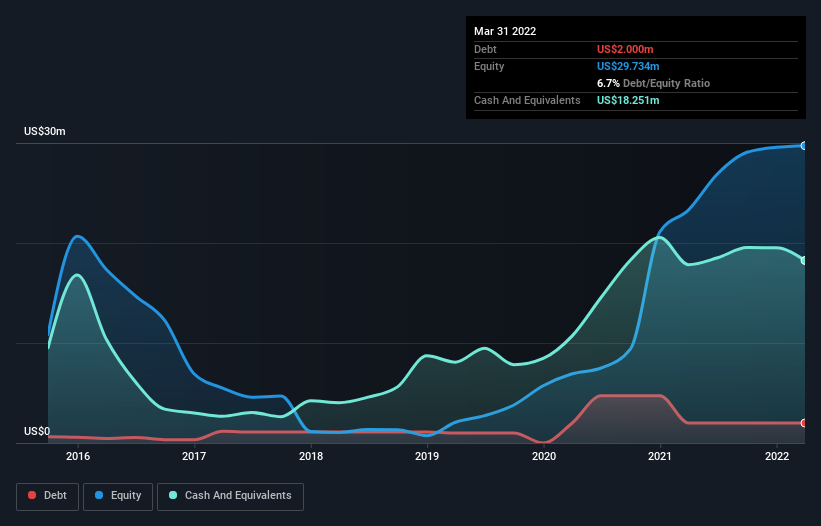
As you can see below, Joint had US$2.00m of debt, at March 2022, which is about the same as the year before. You can click the chart for greater detail. However, it does have US$18.3m in cash offsetting this, leading to net cash of US$16.3m.
How Healthy Is Joint's Balance Sheet?
The latest balance sheet data shows that Joint had liabilities of US$20.6m due within a year, and liabilities of US$34.7m falling due after that. Offsetting these obligations, it had cash of US$18.3m as well as receivables valued at US$3.61m due within 12 months. So its liabilities total US$33.5m more than the combination of its cash and short-term receivables.
Given Joint has a market capitalization of US$238.0m, it's hard to believe these liabilities pose much threat. However, we do think it is worth keeping an eye on its balance sheet strength, as it may change over time. While it does have liabilities worth noting, Joint also has more cash than debt, so we're pretty confident it can manage its debt safely.
The modesty of its debt load may become crucial for Joint if management cannot prevent a repeat of the 53% cut to EBIT over the last year. When a company sees its earnings tank, it can sometimes find its relationships with its lenders turn sour. There's no doubt that we learn most about debt from the balance sheet. But ultimately the future profitability of the business will decide if Joint can strengthen its balance sheet over time. So if you want to see what the professionals think, you might find this free report on analyst profit forecasts to be interesting.
Finally, a business needs free cash flow to pay off debt; accounting profits just don't cut it. While Joint has net cash on its balance sheet, it's still worth taking a look at its ability to convert earnings before interest and tax (EBIT) to free cash flow, to help us understand how quickly it is building (or eroding) that cash balance. Happily for any shareholders, Joint actually produced more free cash flow than EBIT over the last three years. There's nothing better than incoming cash when it comes to staying in your lenders' good graces.
Summing Up
Although Joint's balance sheet isn't particularly strong, due to the total liabilities, it is clearly positive to see that it has net cash of US$16.3m. And it impressed us with free cash flow of US$5.8m, being 128% of its EBIT. So we are not troubled with Joint's debt use. There's no doubt that we learn most about debt from the balance sheet. But ultimately, every company can contain risks that exist outside of the balance sheet. For example, we've discovered 2 warning signs for Joint that you should be aware of before investing here.
If, after all that, you're more interested in a fast growing company with a rock-solid balance sheet, then check out our list of net cash growth stocks without delay.
Have feedback on this article? Concerned about the content? Get in touch with us directly. Alternatively, email editorial-team (at) simplywallst.com.
This article by Simply Wall St is general in nature. We provide commentary based on historical data and analyst forecasts only using an unbiased methodology and our articles are not intended to be financial advice. It does not constitute a recommendation to buy or sell any stock, and does not take account of your objectives, or your financial situation. We aim to bring you long-term focused analysis driven by fundamental data. Note that our analysis may not factor in the latest price-sensitive company announcements or qualitative material. Simply Wall St has no position in any stocks mentioned.
